This monthly chart shows that NVDA had a green line break-out (GLB) to an ATH last week. This is one fallen angel that made it back.
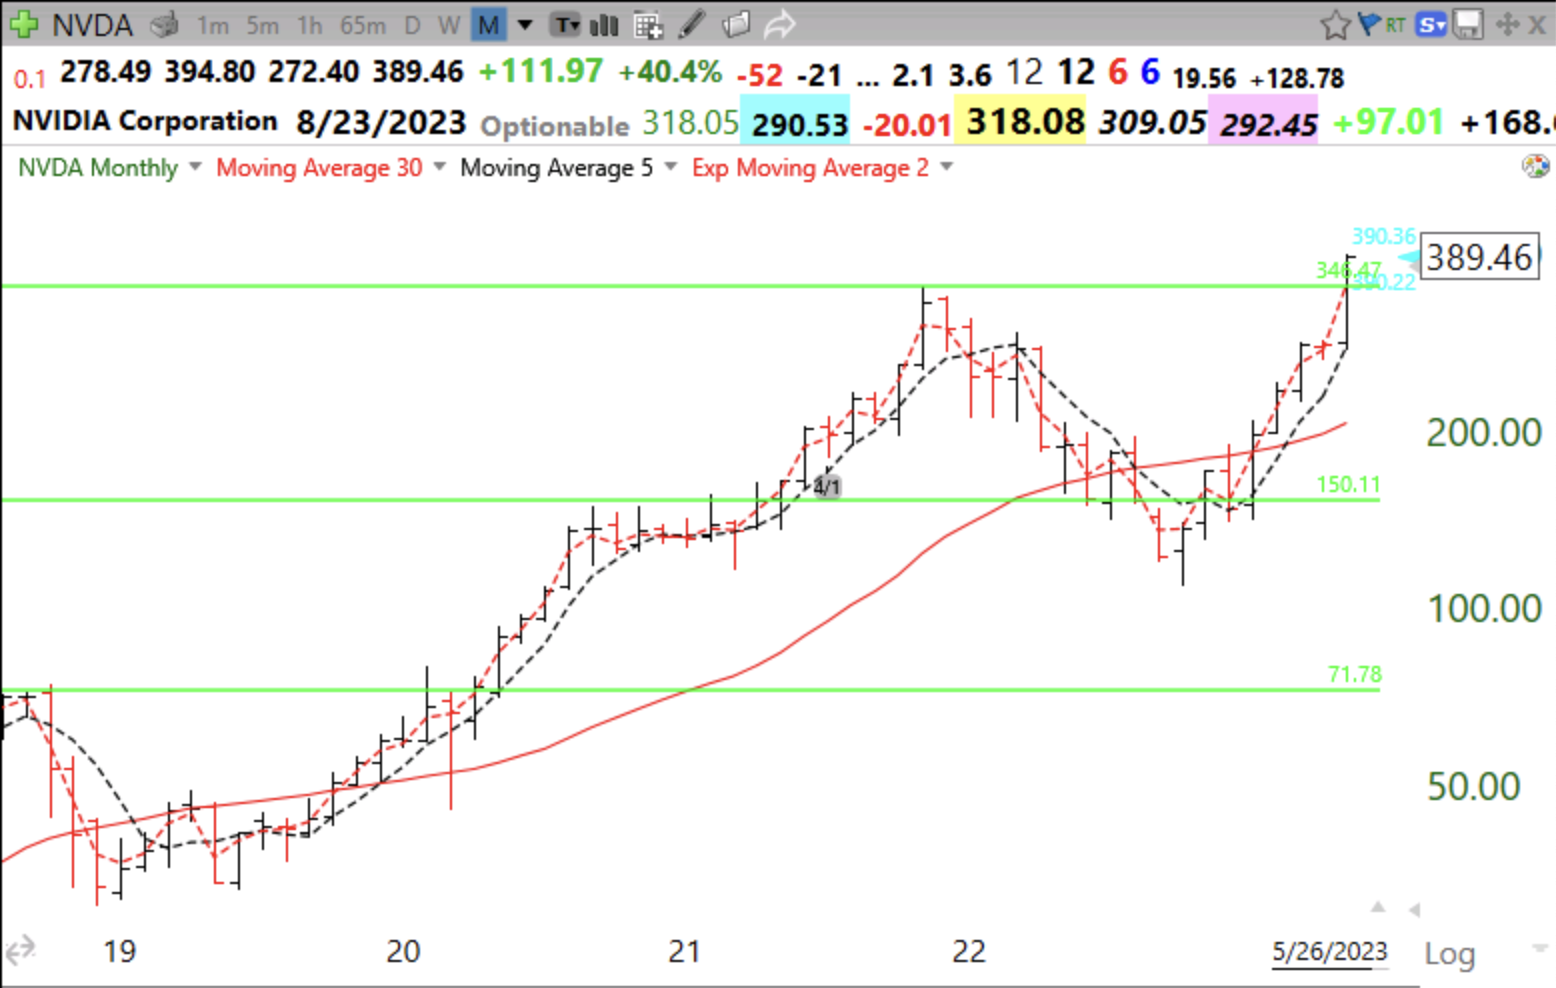
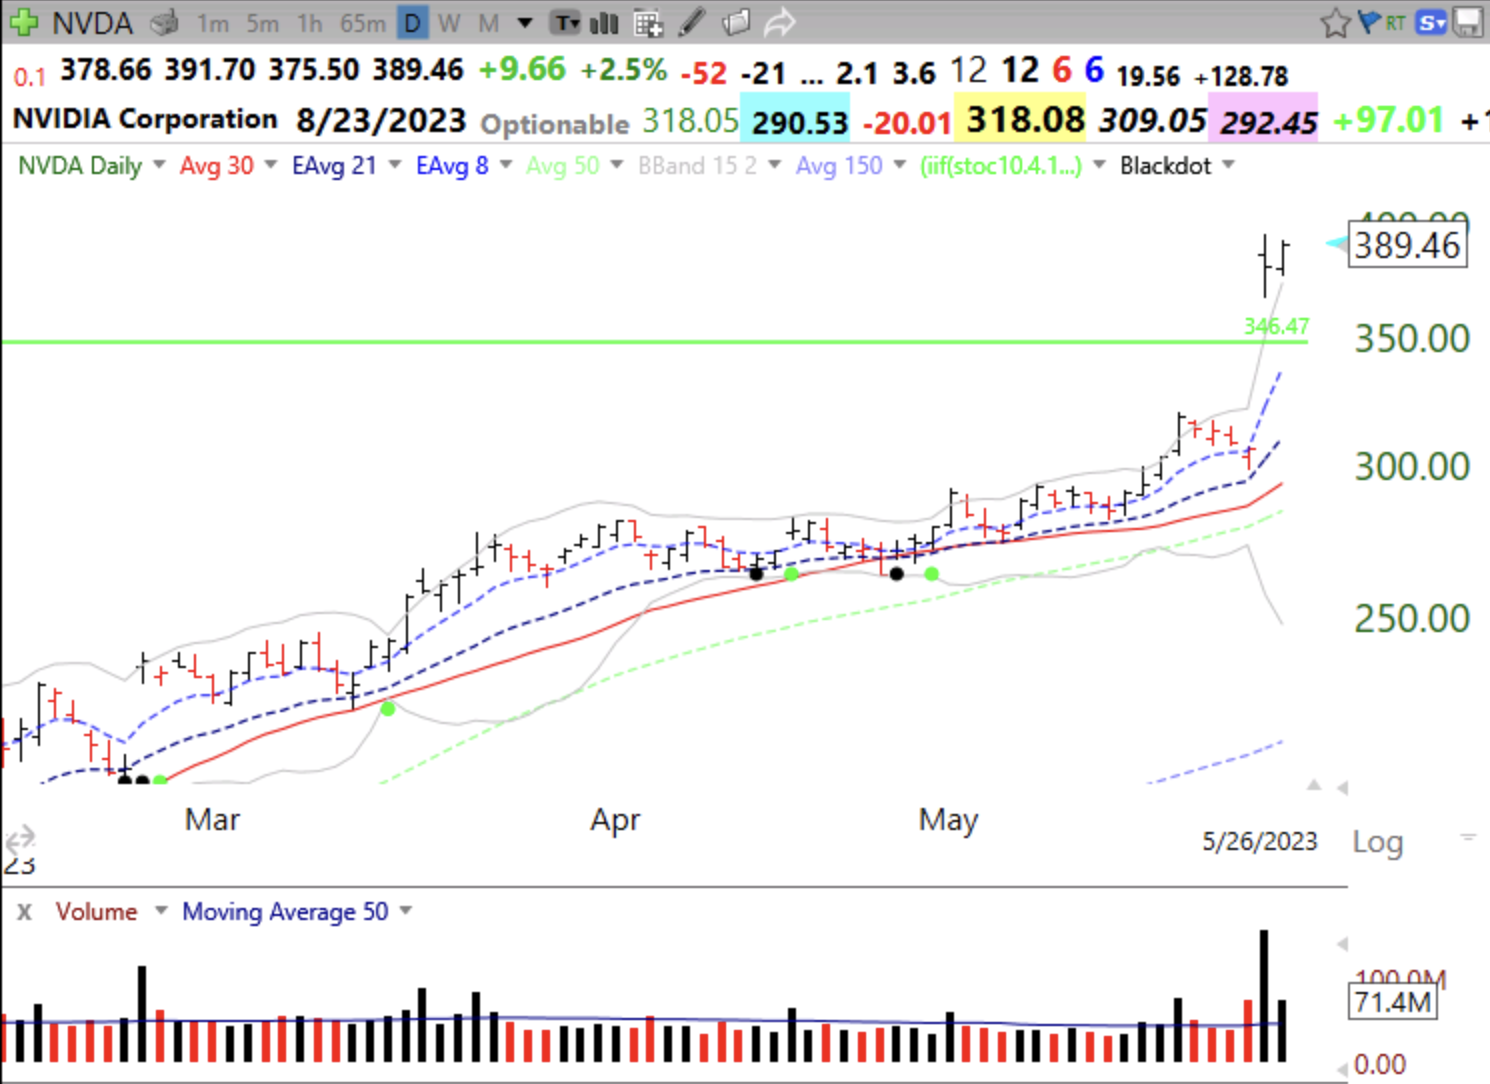
Here is its daily chart. Note the huge volume on the day of the break-out after earnings were released. To avoid being a failed GLB, NVDA should not close back below its green line, at 346.47.
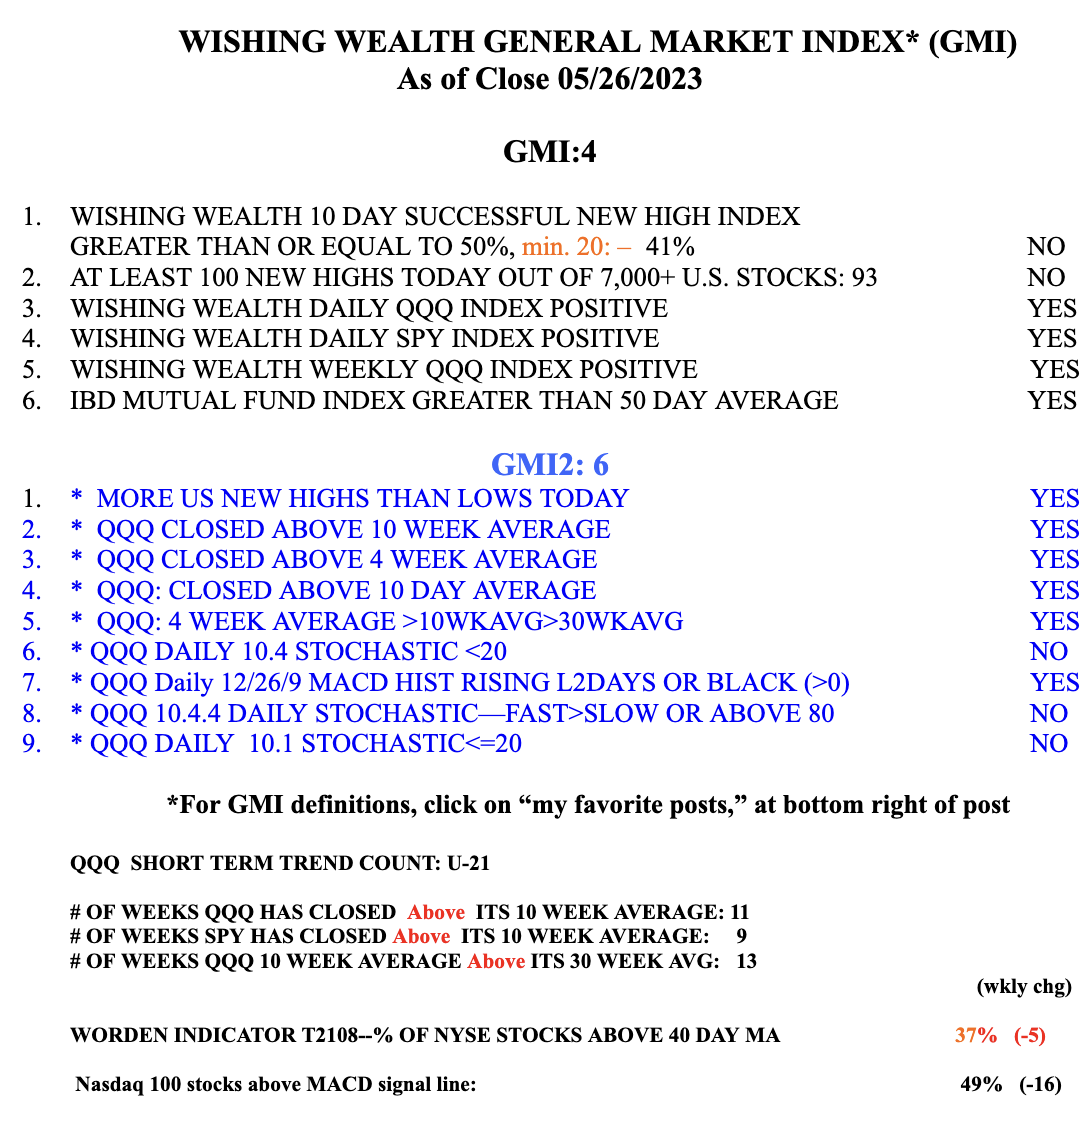
The GMI remains Green, at 4 (of 6).