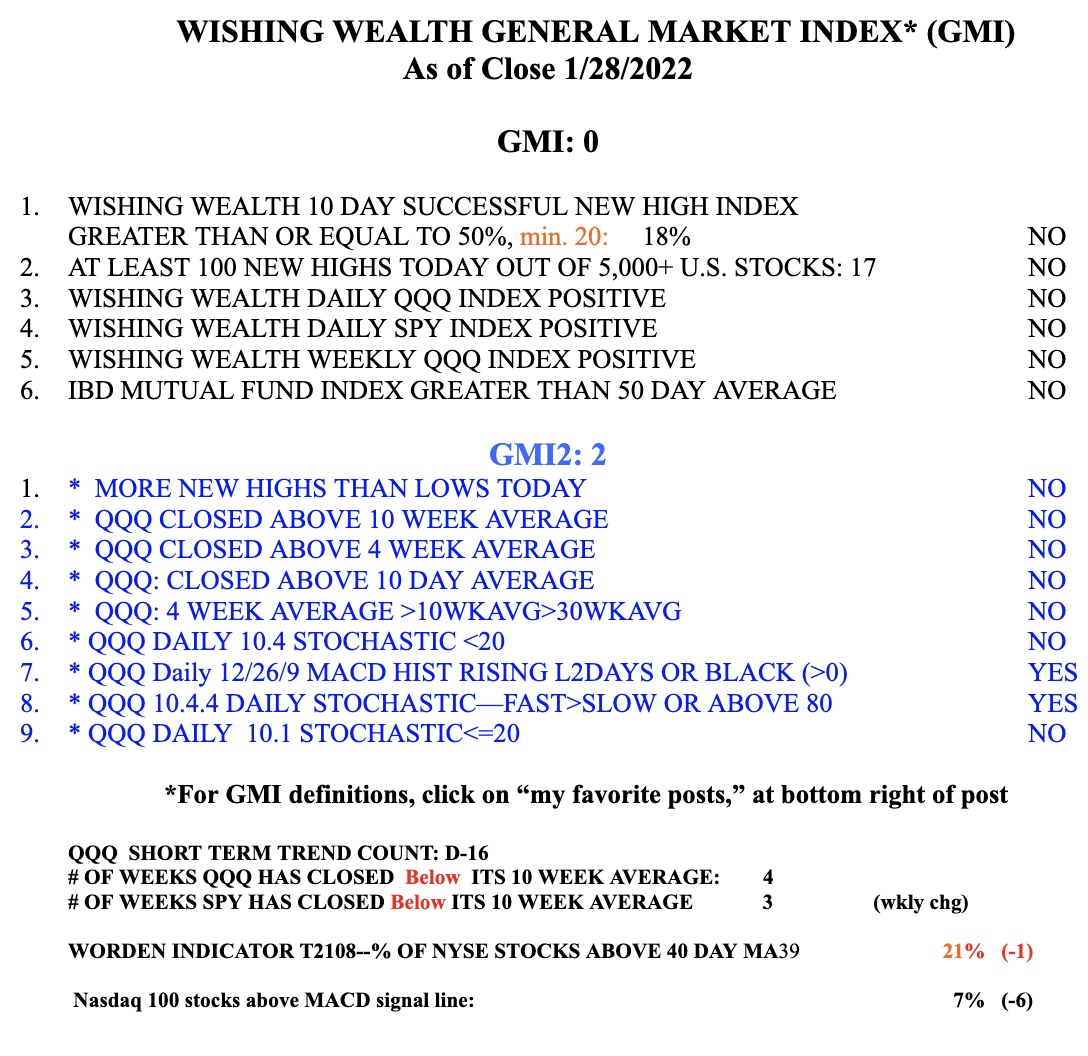
General Market Index (GMI) table
Blog post: Scan found 13 out of 350 IBD/MS type stocks that reached ATH last week: $KO and $HSY, see list; Richard Moglen’s new interview with @PatrickWalker56 is terrific!
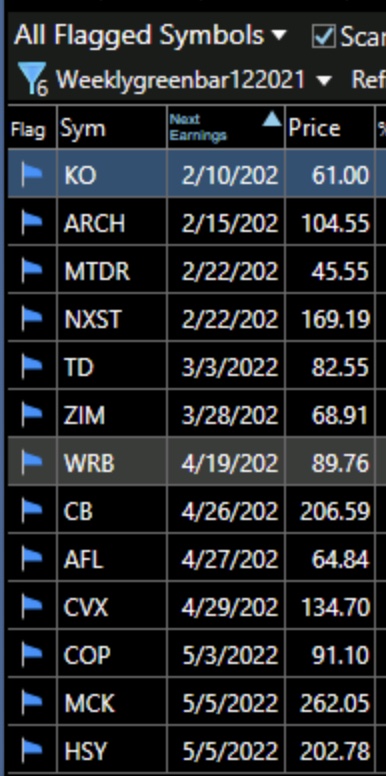
I ran my TC2000 scan of stocks on my IBD/MarketSmith watchlist of 350 stocks and it identified the 13 stocks below. These stocks all hit an all-time high last week, have strong weekly chart up-trends and bounced up above their 4 week averages. It is noteworthy that KO and HSY came up. I guess stock buyers think people will not give up buying chocolate and Coke during inflationary times. I am actually 100% in cash in my university pension and my trading accounts now. I am content to wait on the sideline while Mr. Market reveals his next direction. All major indexes (DIA, SPY, QQQ, IWM) closed the week below their key 30 week averages. Could they be beginning Stage IV declines?
Below are the 13 stocks that my scan detected, ordered by next earnings date. I am not buying anything now and if I had, and any of these were to close below their 4 week averages or green line tops, I would exit immediately. Fun to just watch. By the way, my former extraordinary student, Richard Moglen, taped a second interview with Patrick Walker, who also lectured to my class last semester–it is well worth watching.
The GMI remains Red and =0, of 6.

Blog post: Day 16 of $QQQ short term down-trend; Some end of decline signs I am looking for; Promising stock scan finds 2 shipping stocks at ATHs: $ZIM and $MATX, see chartss
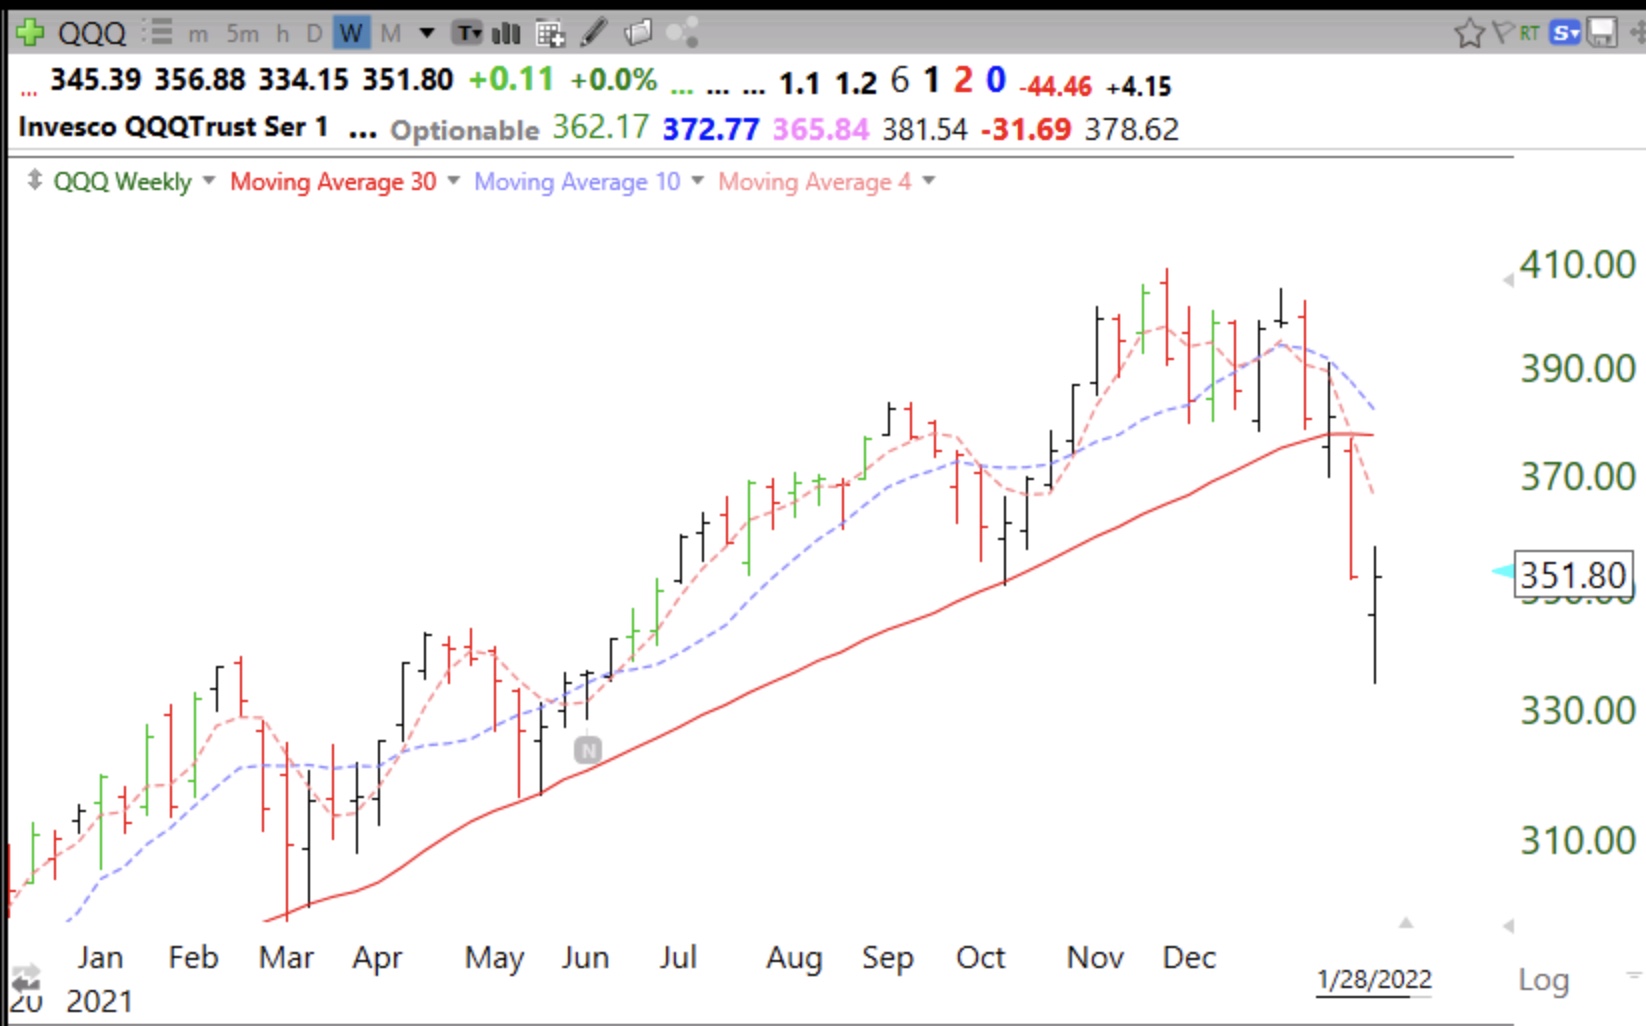
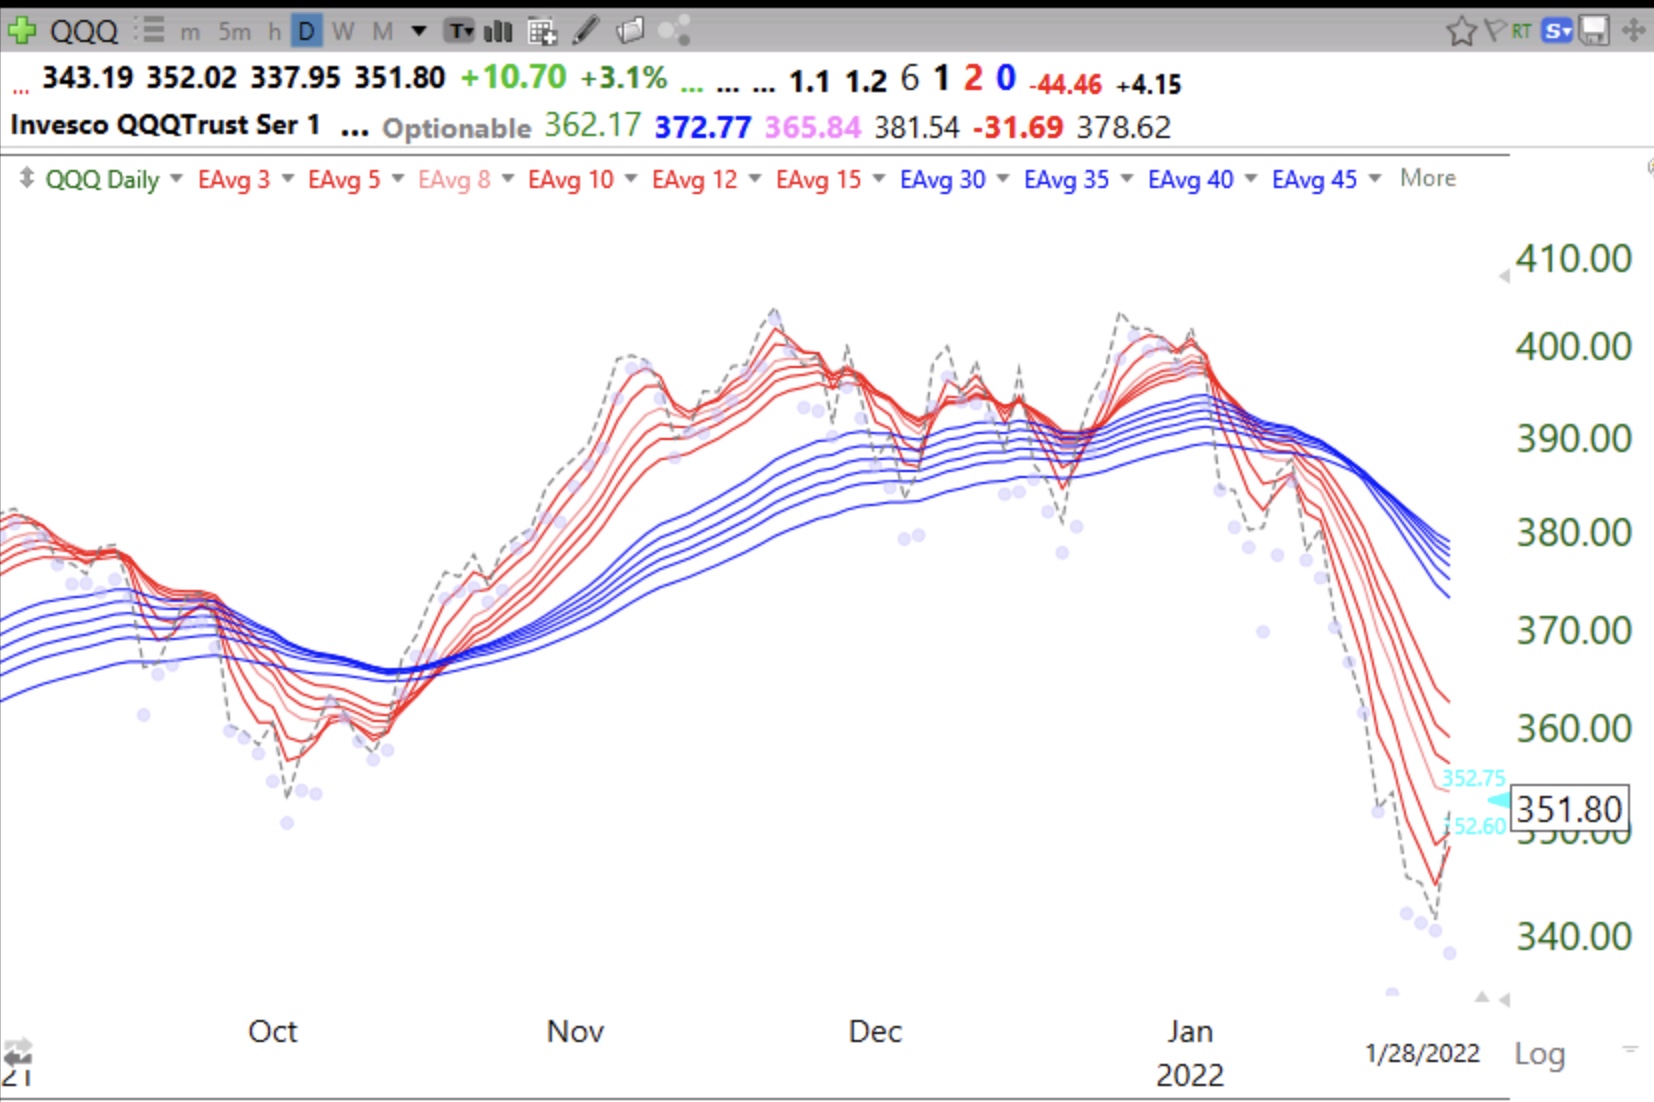
Once a significant decline has begun, no one knows when it will end. Now that the QQQ is below its 30 week average (solid red line), the first thing I will look for is a close above that average. But as I showed in last week’s AAII Eastern Michigan Chapter webinar (will post link to recording here when I receive it), the index can whip-saw above and below that average. I therefore want to see the 30 week average curving up again. That is the definitive signal to get me back in. Other important early indicators of a possible bottom are the p/c ratio >1.10 and T2108 <10%. T2108 reached 12% last week and is now at 21%. The p/c ratio=.93 and reached 1.08 last week. If T2108 goes below 10% I will buy a little SPY and buy more only at higher levels after a bottom is in. Here is the weekly chart of QQQ.
Another chart I will monitor is my daily adapted GMMA. When it returns to a daily RWB up-trend it could indicate a short term bounce.
By definition, a trend follower follows the trend. I will get back in long after a bottom is formed, not before. Going in early in anticipation of a change in trend often leads to losses. If the 30 week average curves down it will signify to me the beginning of a major decline. At least that is what has signaled the start of prior bear markets, also shown in my webinar.
Just for fun I ran my TC2000 scan for promising stocks near their all-time-high and having strong technicals. Only 4 stocks appeared out of 777 in my watchlist of stocks that have appeared in promising IBD and MarketSmith lists. These are: MATX, ZIM, MCK and COP. All 4 traded at all time highs (ATHs) last week. Only in a market up-trend would I buy any of these. Here is the weekly chart for ZIm. Note that it retook its green line last week and reached an all-time high. After a major market decline any stock trading at its ATH is a potential leader.
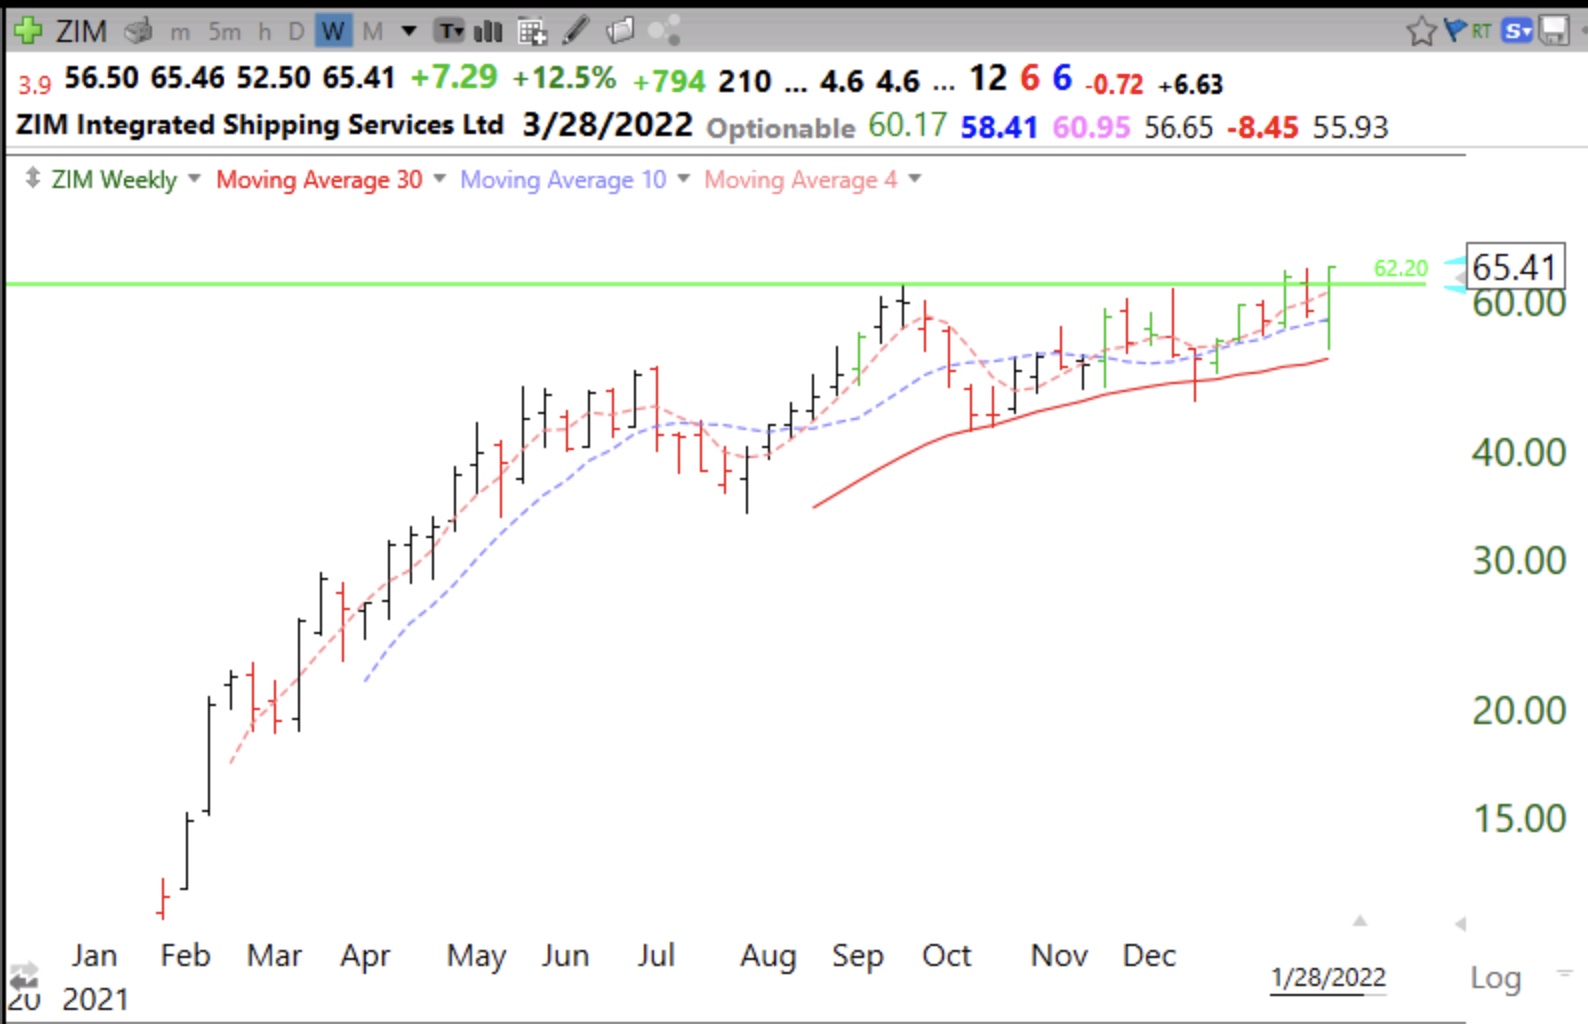
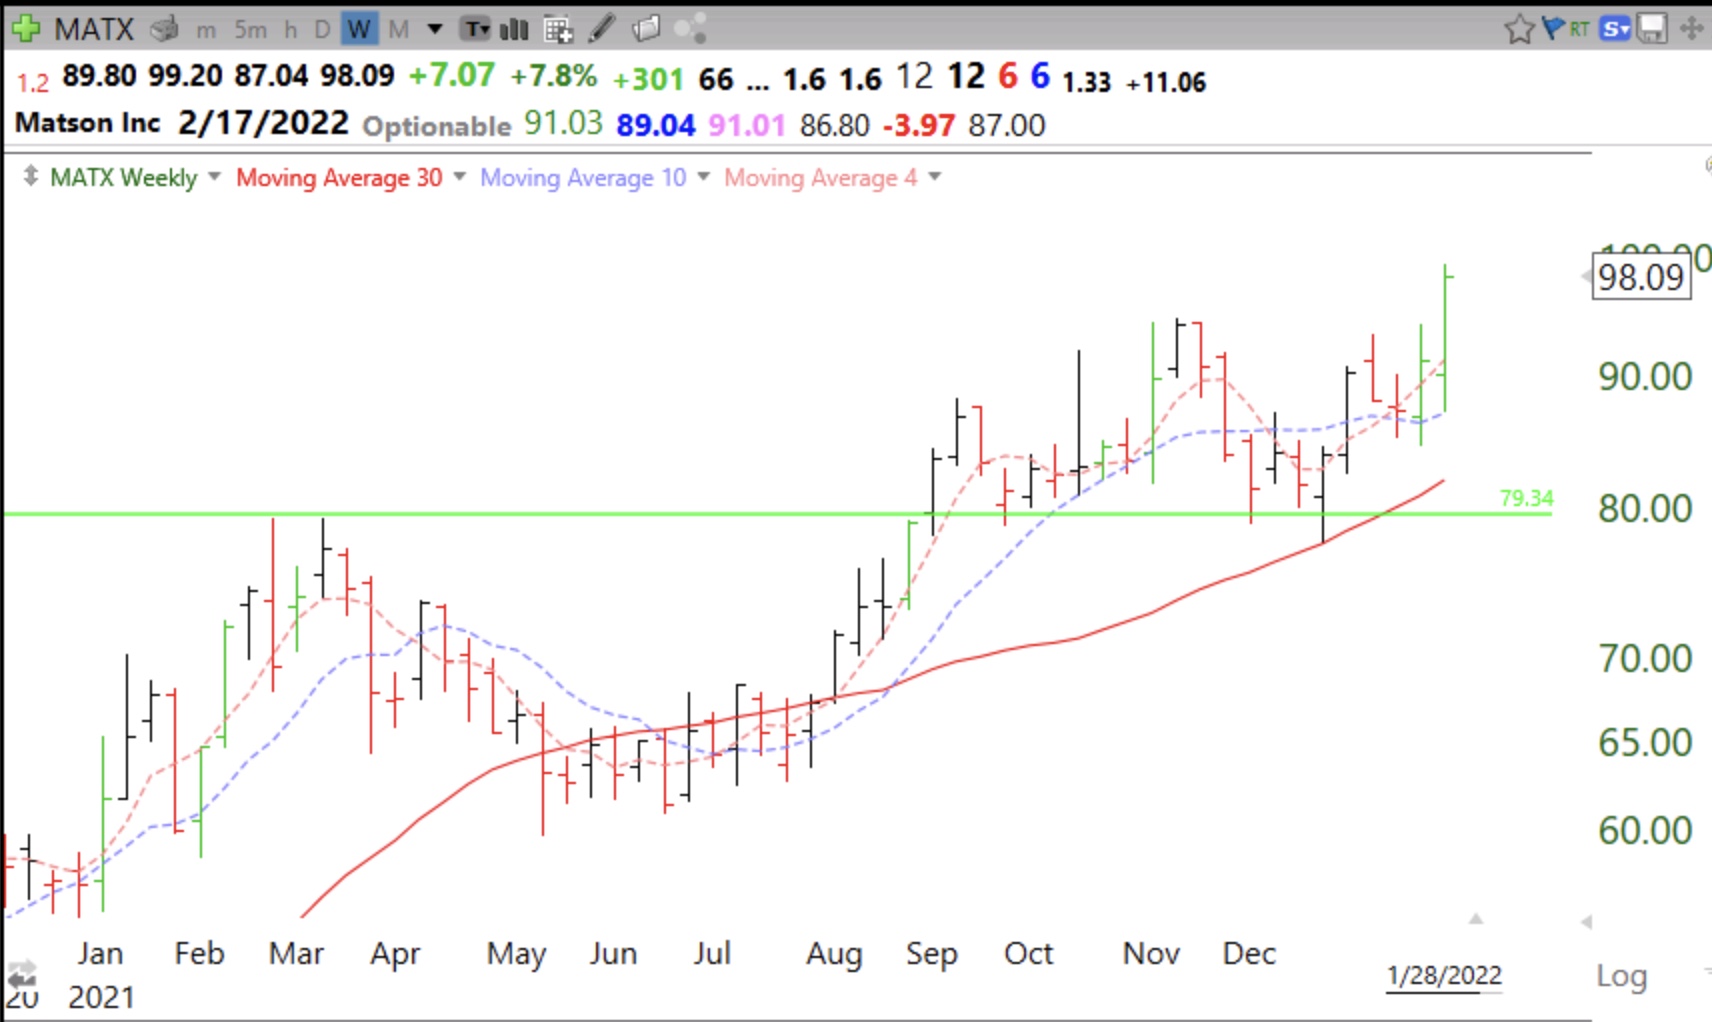
Interesting that 2 of 4, both ZIM and MATX, are in the shipping business. MATX is also above its last green line top.
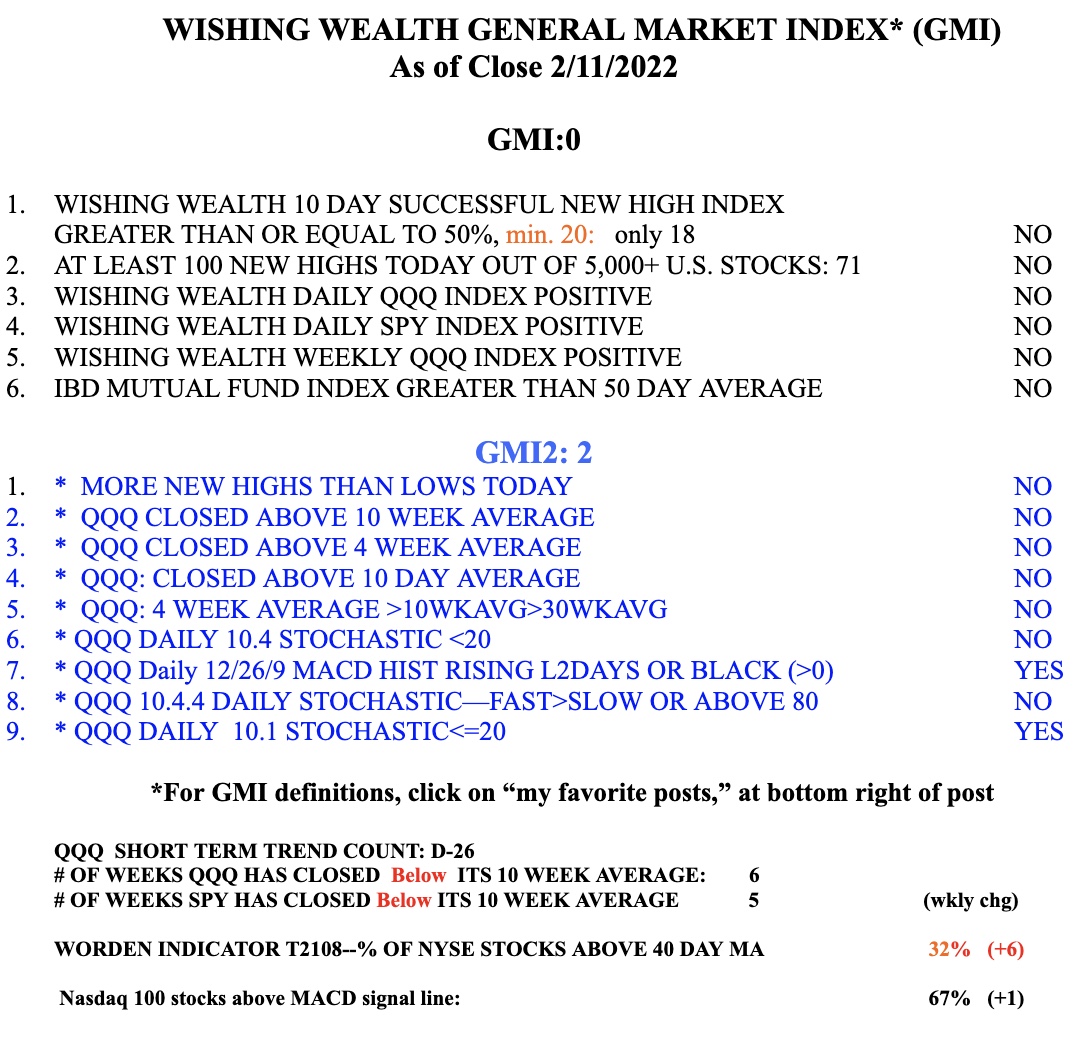
The GMI= 0/6 and Red. It is so much easier to profit going long when the GMI is on a Green signal. I stay out and conserve my capital for the next sustained up-trend. Watch out for brief bear market rallies.They can be treacherous.