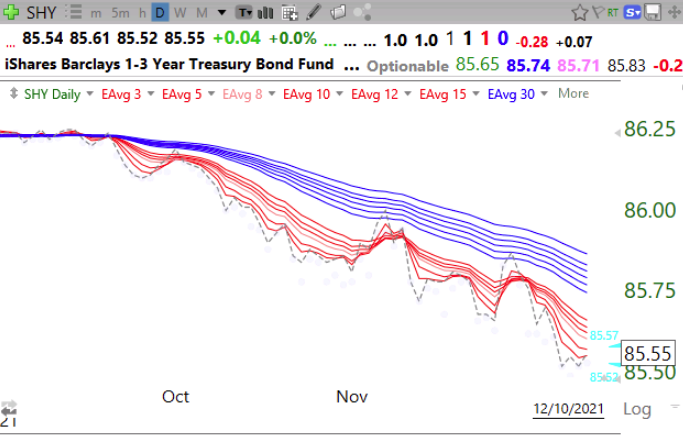
With SHY falling, short term interest rates are rising. This makes sense with the Fed reporting they are ready to enhance tapering of bond buying and to raise rates.
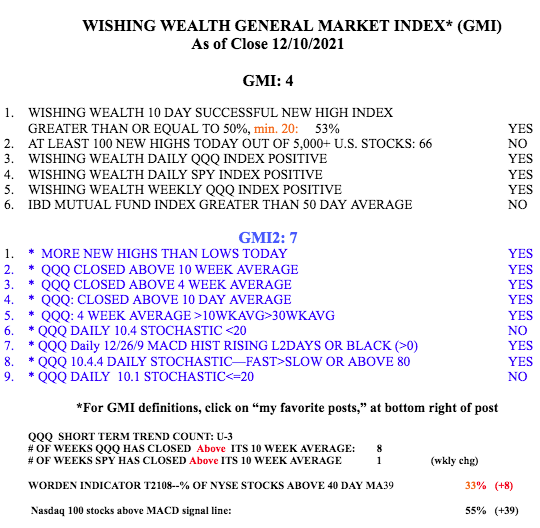
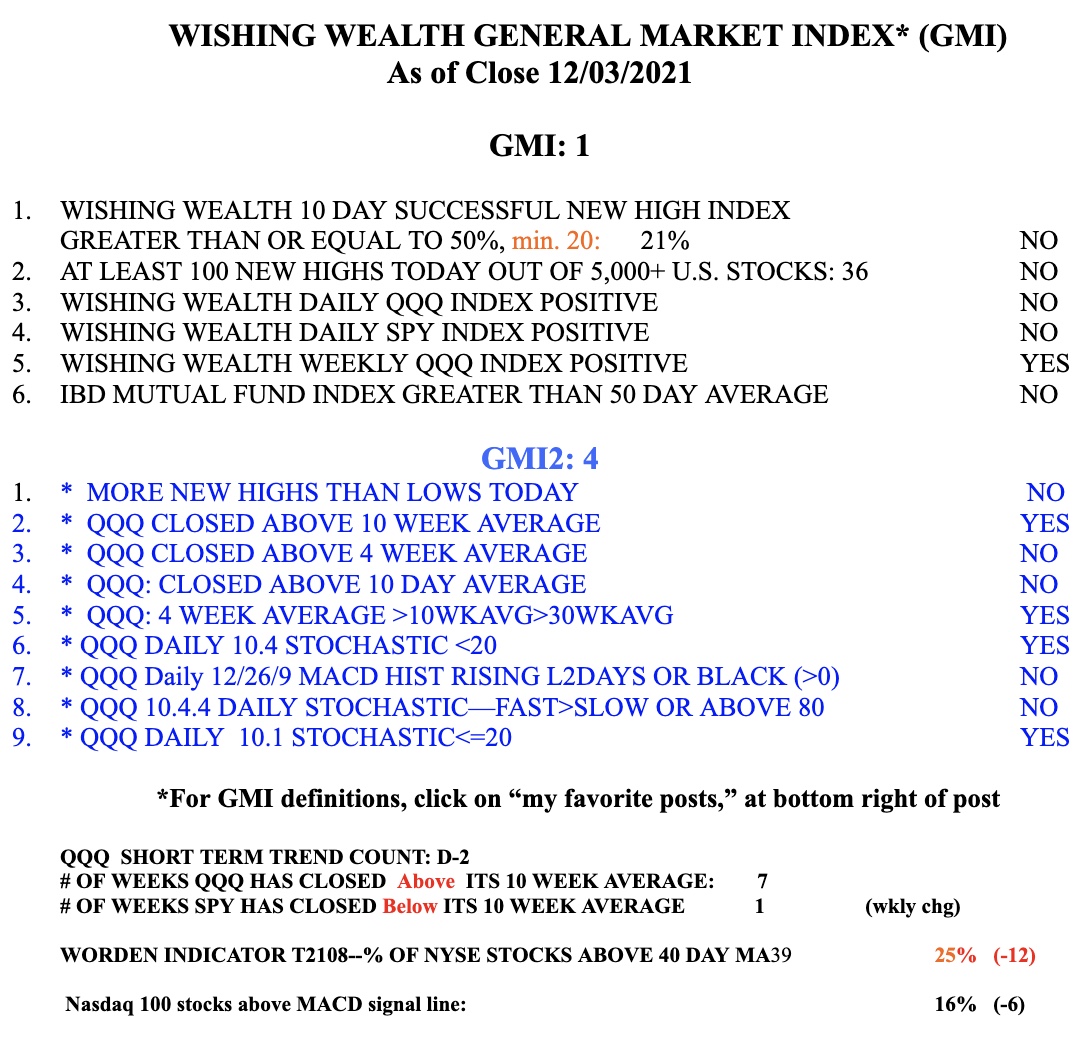
With the GMI=4, it could flash a Green signal with another day above 3.
Stock Market Technical Indicators & Analysis
With SHY falling, short term interest rates are rising. This makes sense with the Fed reporting they are ready to enhance tapering of bond buying and to raise rates.
With the GMI=4, it could flash a Green signal with another day above 3.
The GMI-2 actually climbed from 2 to 4 on Friday. That is because two of my daily stochastic indicators (10.1 and 10.4) reached very oversold levels. In addition, the put/call ratio on Friday registered 1.00. A ratio above 1 usually leads to a bounce in the market. It means that traders are buying as many or more puts as calls. Put options are used to bet on a decline or as insurance to hedge against a decline and calls are used to bet on an advance. The ratio is a contrarian indicator such that when there are more bearish bets than calls, the market tends to bounce up (in the other direction).
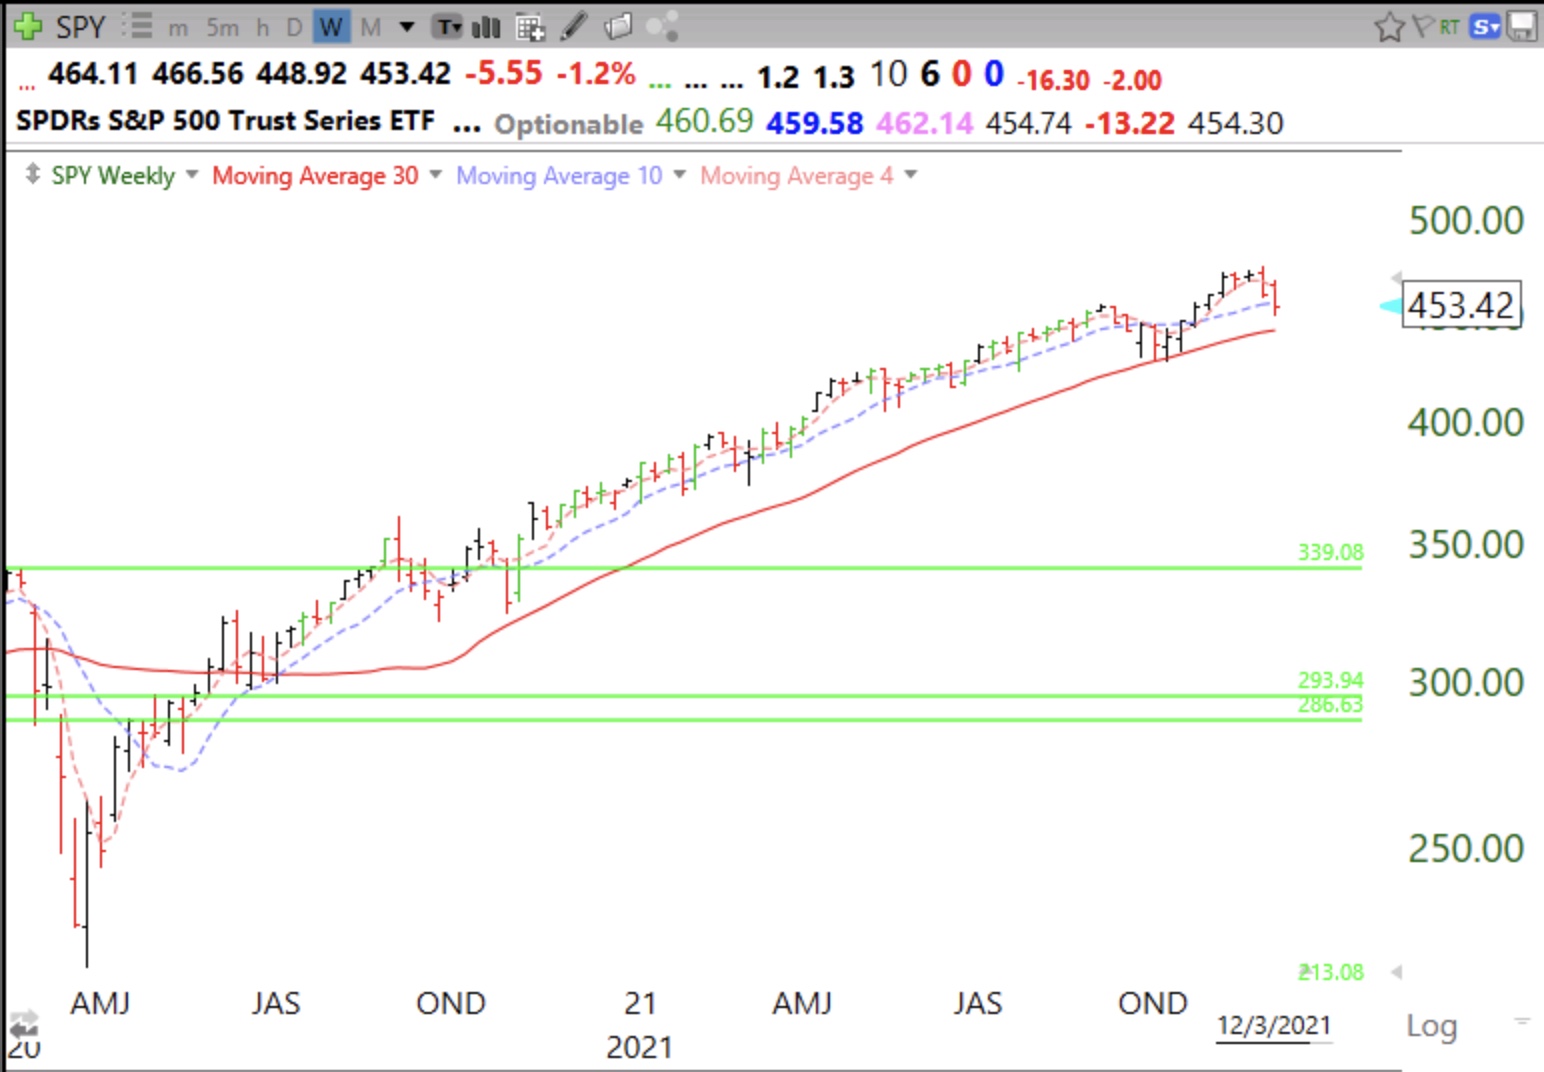
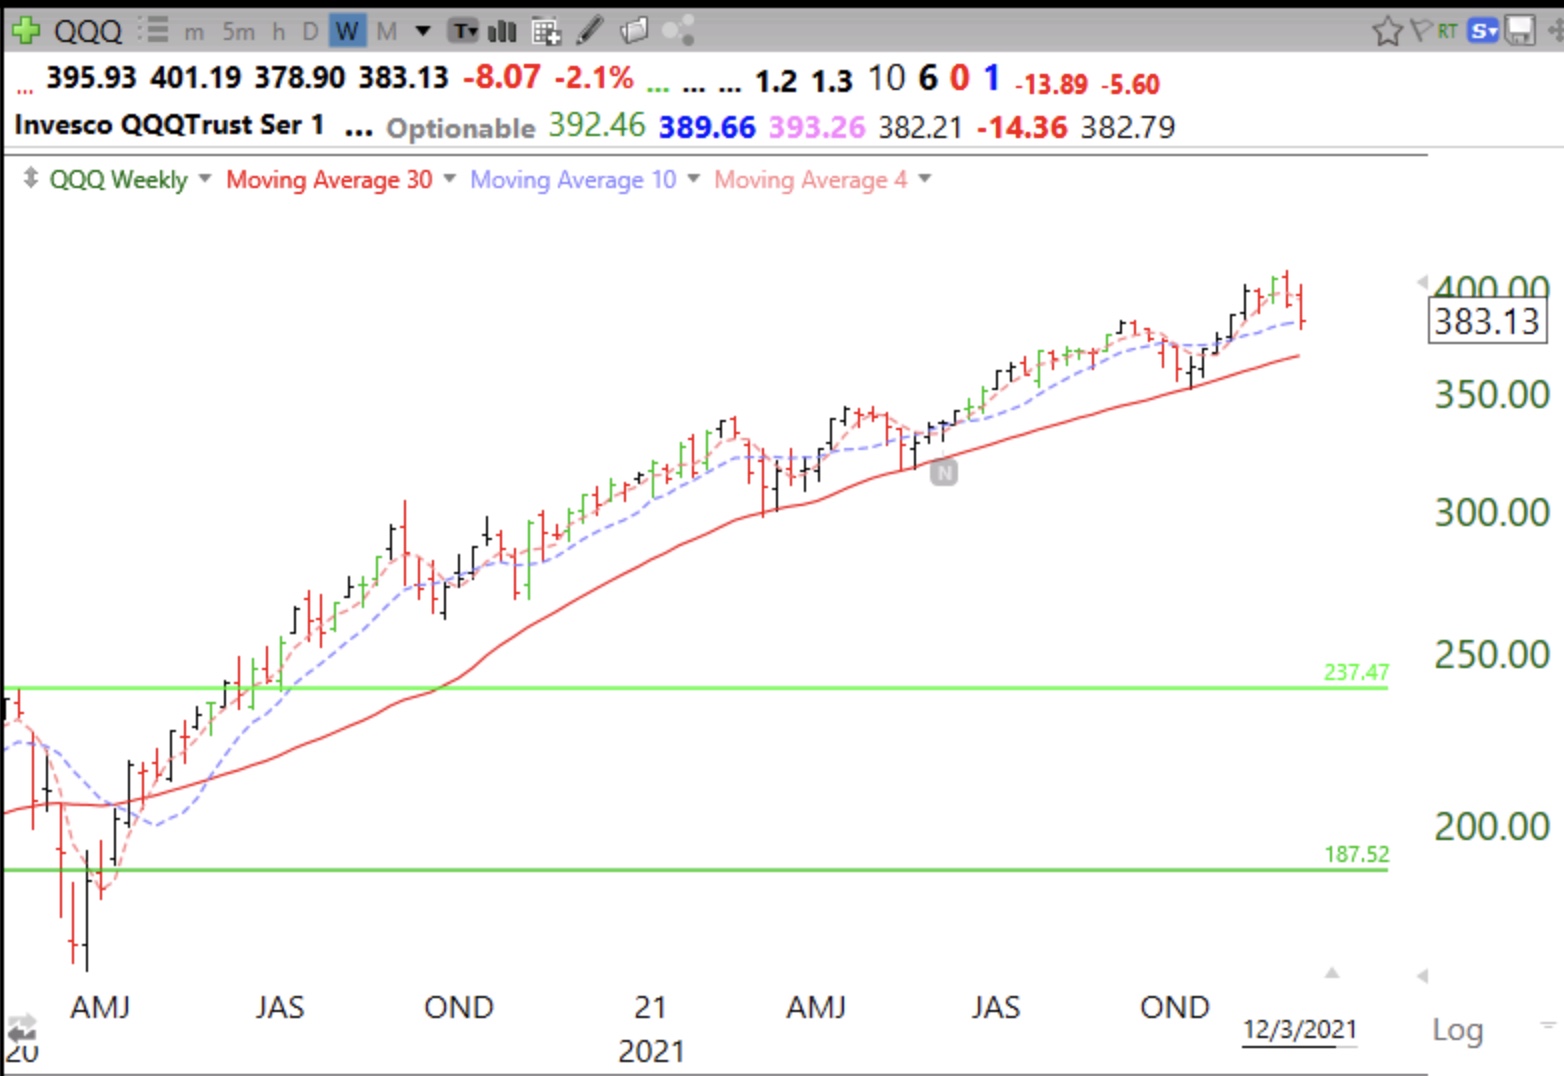
T2108 is at 25%, which is low, but not as low as is typical at a market bottom. The GMI is 1, of 6. The last GMI component to turn negative will be for the weekly QQQ to close below its 30 week average. When that happens I will begin to go to cash in my primary pension accounts. What is troubling me is that the DIA is already below its 30 week average. The SPY remains above it and the QQQ remains far above its 30 week average. There are too many more 52 week lows than highs. So, for now, I remain very cautious and largely in cash in my trading IRA.
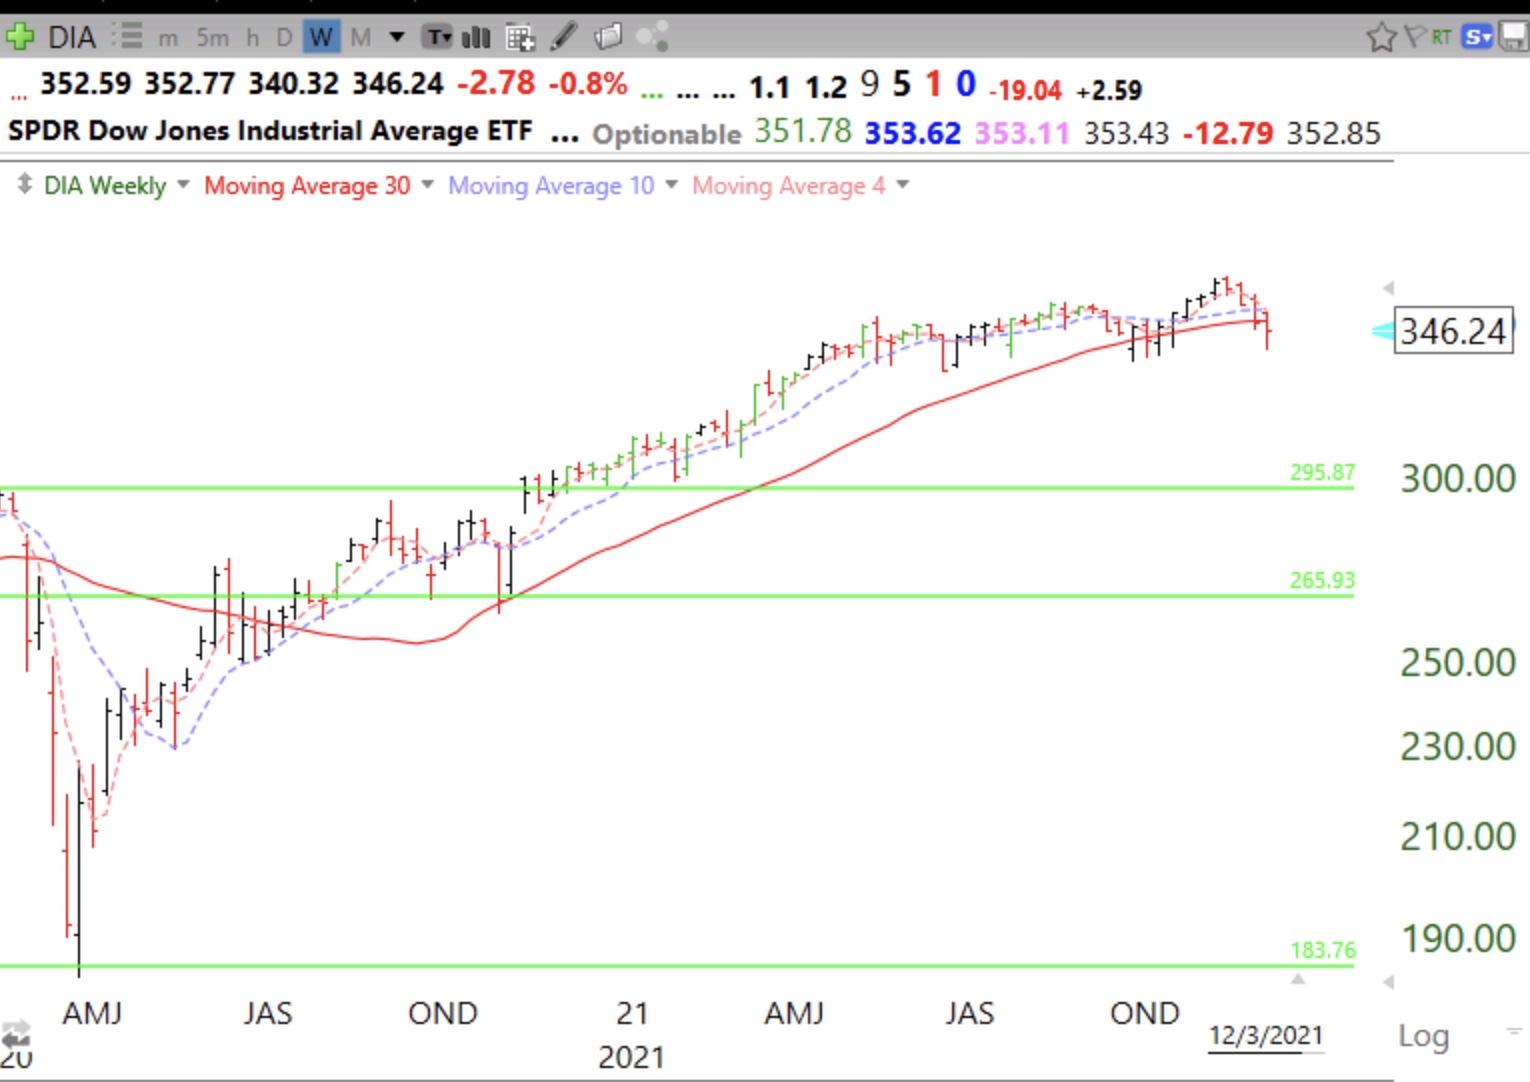
If we get a good year-end rally I will likely sell some of my mutual funds in my university pension accounts. With the Fed ready to tighten, this market’s next big move next year will likely be down. NEVER trade against the Fed. Higher rates will suck the money out of equities. Here are the weekly charts of the DIA, SPY and QQQ. The 30wk average is the red solid line. Once these indexes close below their 30 week averages and the averages begin to curve down, it is usually the BEGINNING of a major decline. Stay tuned……..
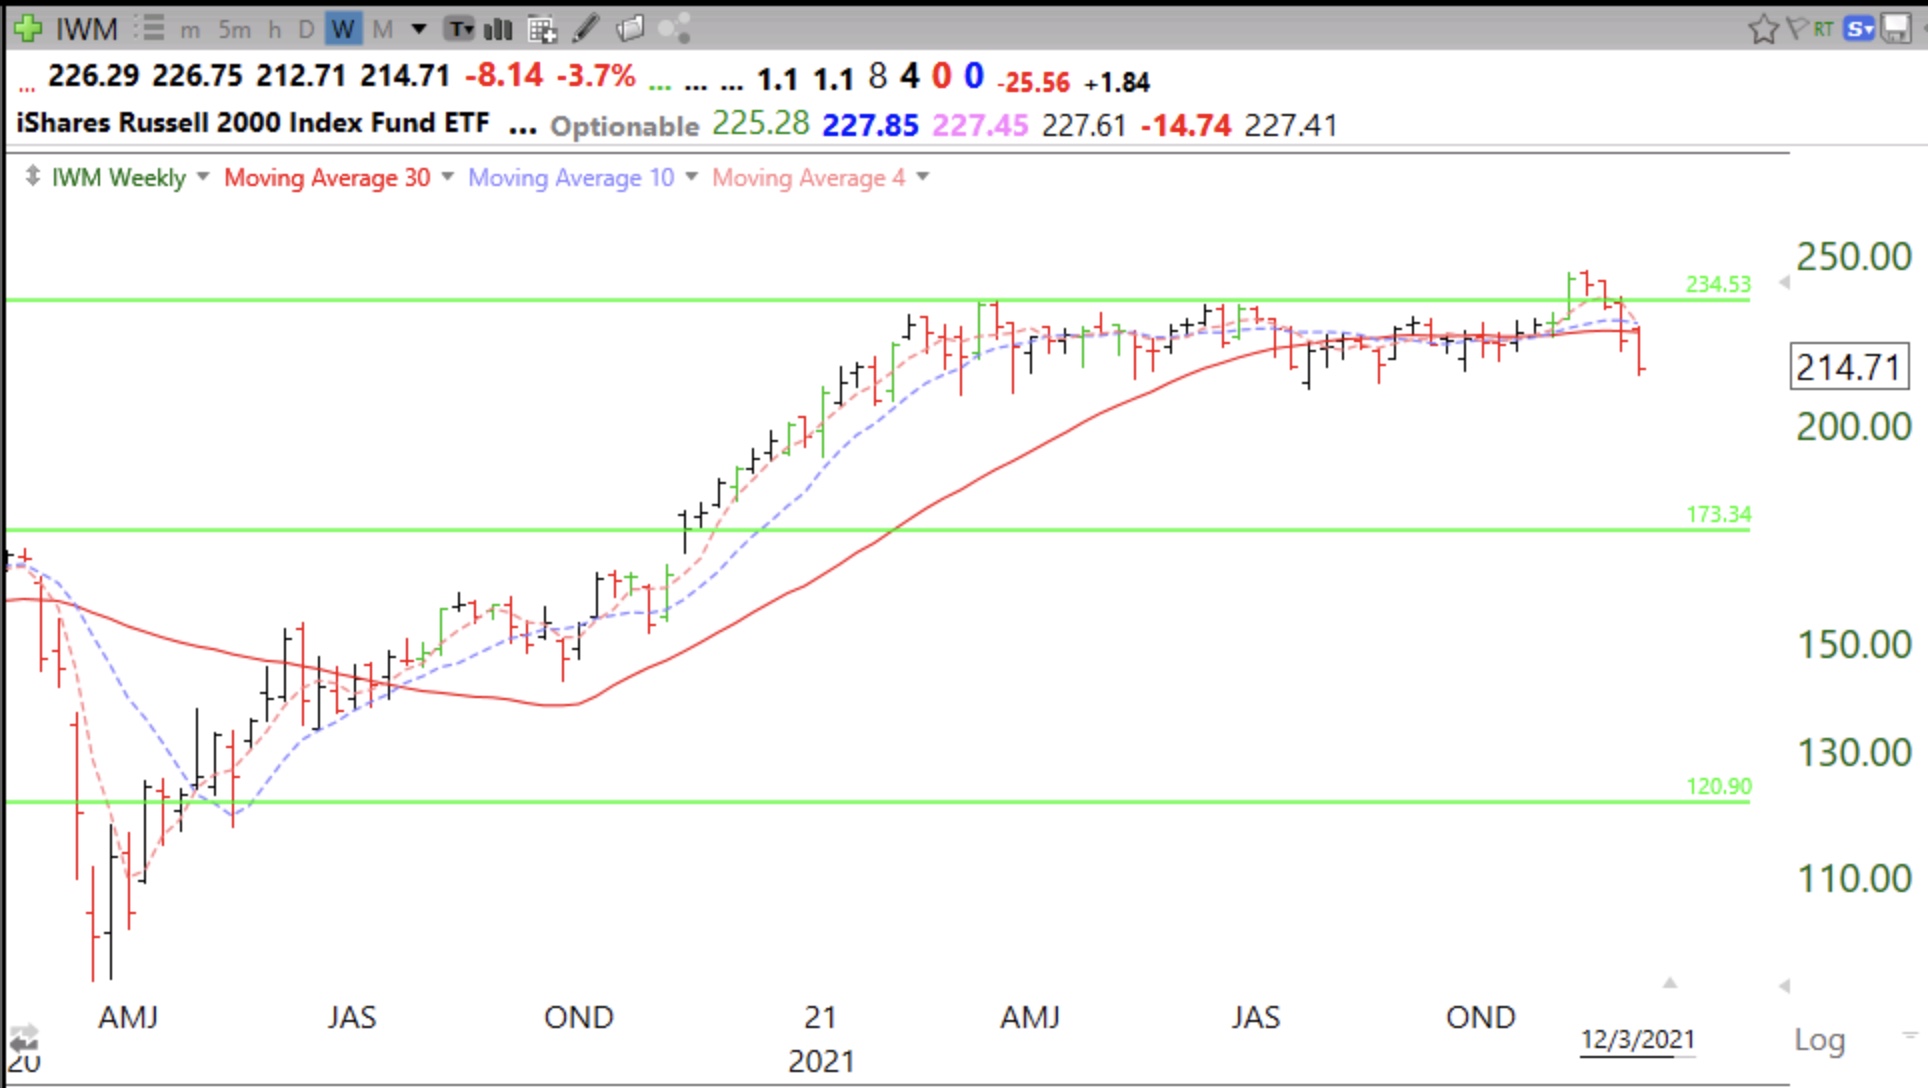
Note how terrible small stocks have been doing all year, reflected in the Russell 2000 index ETF, IWM. Entering Stage IV decline?
Friday was Day 2 (D-2) of the new QQQ short term down-trend. The SPY has now closed below its 10 week average. I am very worried about the near term trend of the market. Plenty of time to be long when the GMI is Green again. That will require 2 consecutive days with the GMI above 3.
I have written often that I am a chicken these days with my trading account, as I get closer to retiring. I hold three very small positions on stocks that bounced from oversold and held on Friday. If they fail to hold their bounces on Monday I will be stopped out and 100% in cash. The stock gurus I respect all say there are times to be out of the market. At times like now I sleep better while on the sidelines.
On Friday, there were 370 new lows and 46 new yearly highs among 6700+ US stocks. There were only 13 stocks at all-time-highs (ATH). Those are terrible odds for someone like me who likes to buy stocks at ATH that are bouncing off support or breaking out. Two more weak days will end the QQQ short term up-trend, currently at U-29. Remember, it is not the news itself but the market’s reaction to it that provides an indication of the health and likely direction of the market. Only 18% of stocks that hit a new high 10 days ago closed higher on Friday, what I call successful new highs. On the other hand there were 66% successful new lows–stocks that hit a new low 10 days ago and closed lower on Friday. Shorting new lows has been more likely to be profitable than buying stocks at new highs.
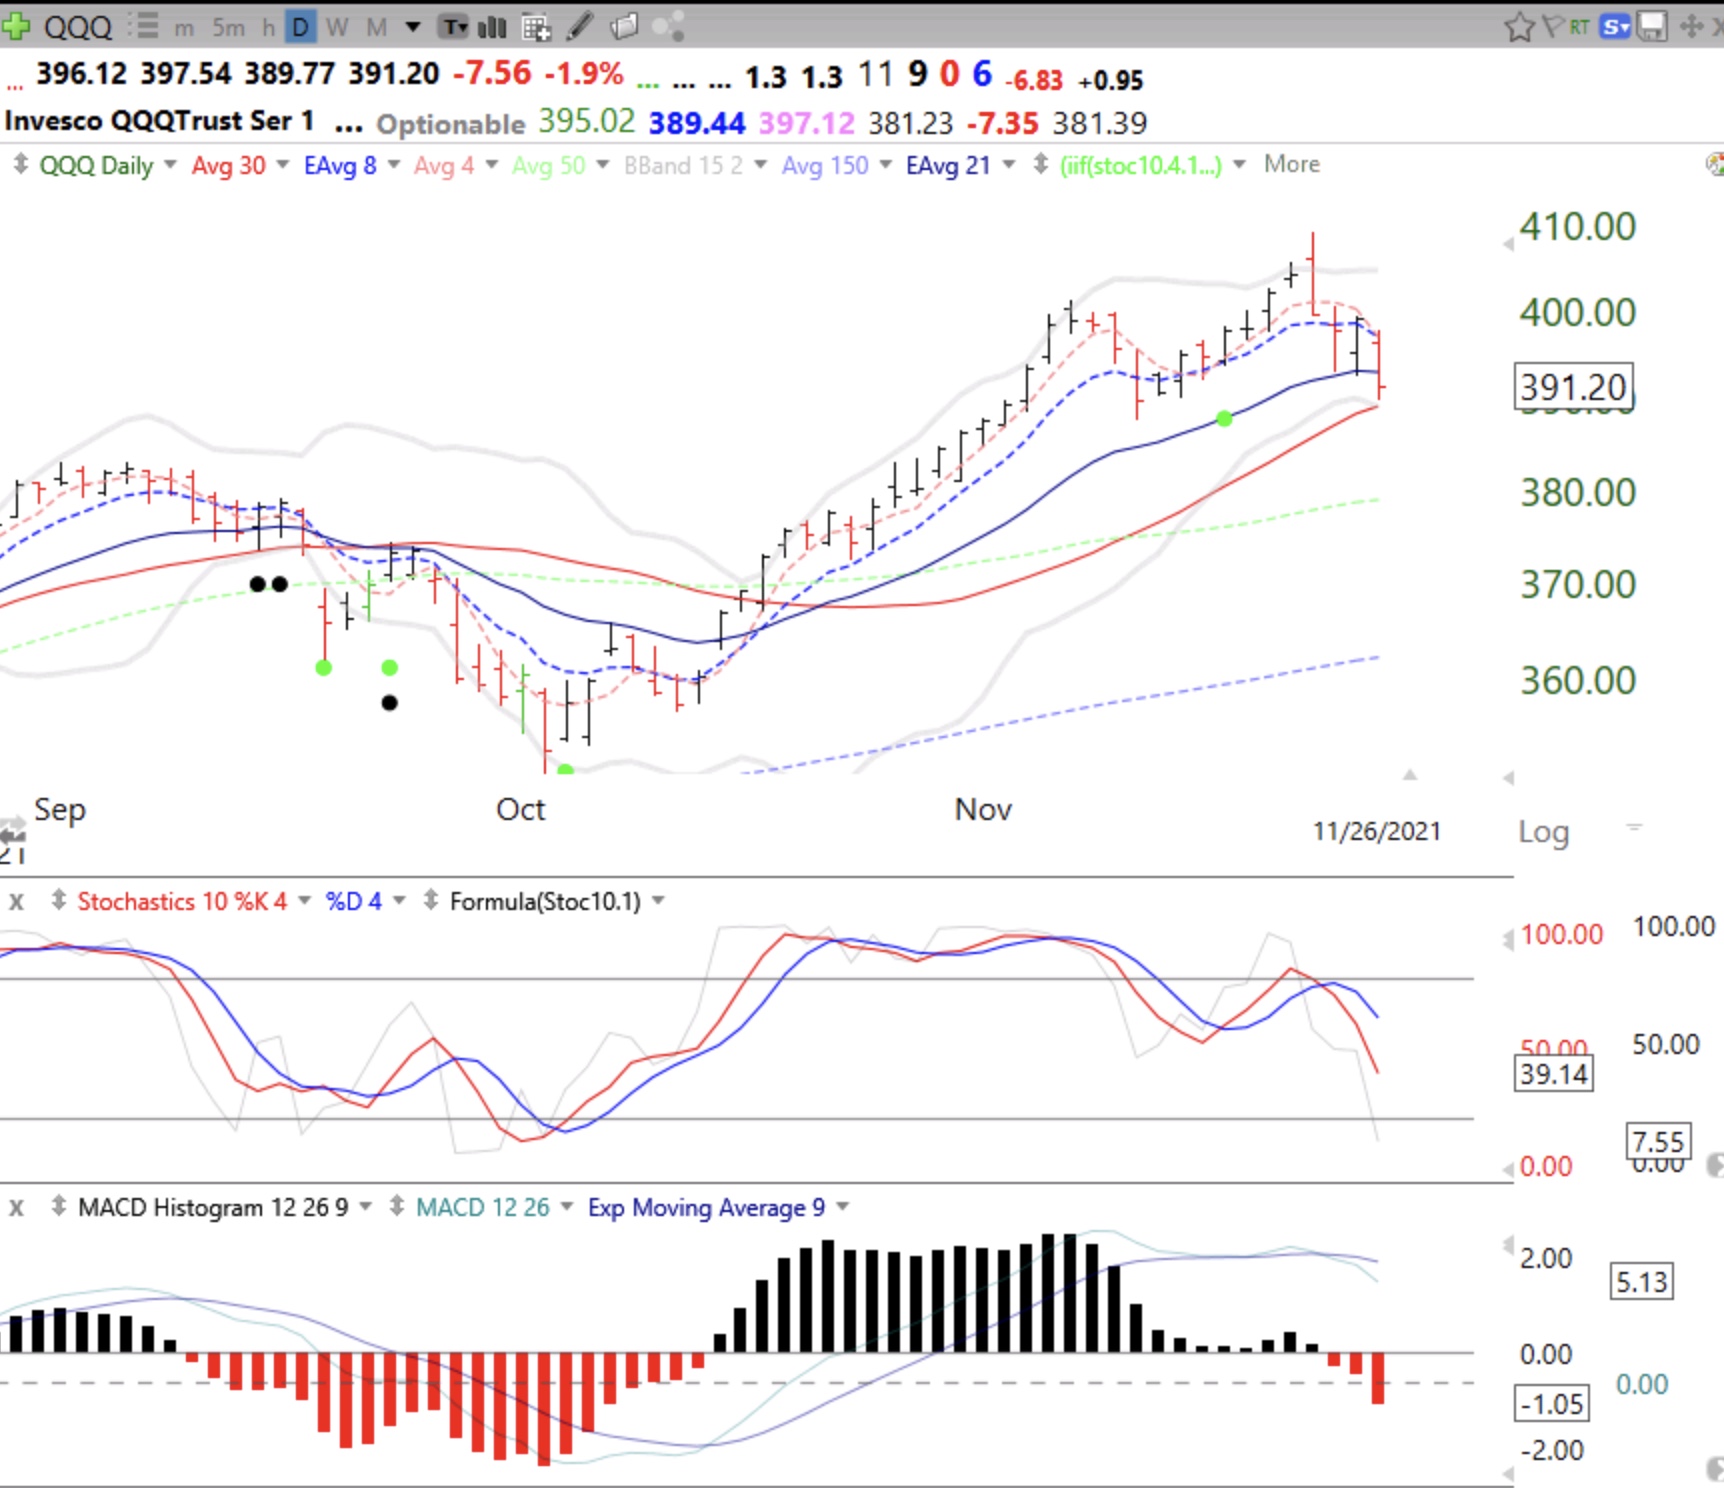
The put/call ratio=.84 on Friday. That was the highest since .88 on September 20, at the beginning of a 19 day QQQ short term down-trend, and a day when only 5% of Nasdaq100 stocks rose. 12% rose on Friday. The daily 10.1 stochastic reached oversold, at 7.55. I would like to see the slower daily 10.4 stochastic, now at 39.14, be less than 20 for a real bounce to occur. See these stochastic indicators at the October low. I am also concerned to see that the MACD 12/26/9 daily histogram is now red and steadily declining. Notice how it climbed at the October bottom. If we get a recovery on Monday, I would not trust it until it proves itself.
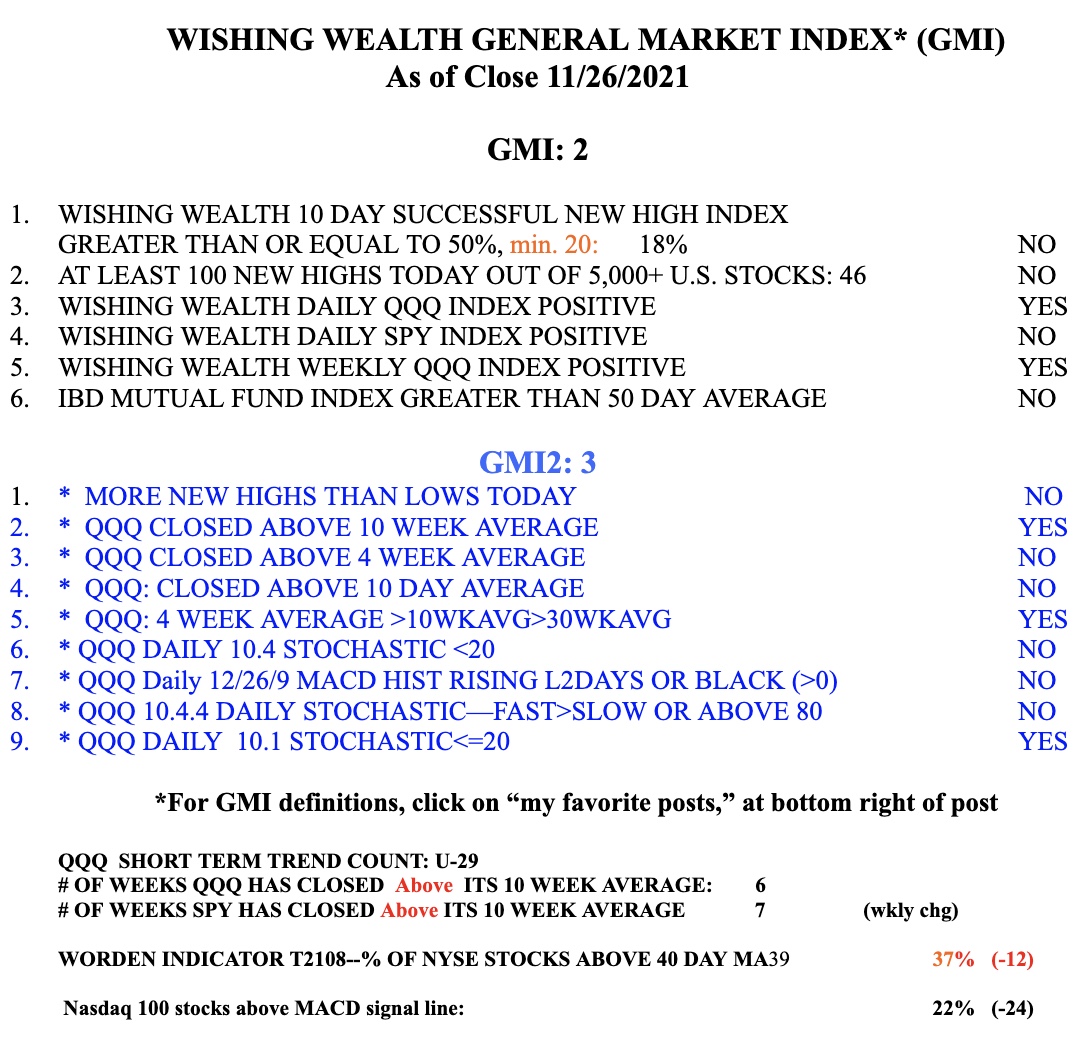
The GMI=2 (of 6) and a second day below 3 will turn its signal Red. The Worden T2108 indicator=37%. Major bottoms are most likely to occur with T2108 below 10%.