Everyone is talking about hiding in safer FDIC insured money market accounts now that one can earn 4%+ in interest, risk free. I told you in November, 2021 that I was exiting the market because the Fed would raise interest rates and that would suck the $$$ out of stocks. Now get ready for the reverse. We are closer to a decline in rates and that will eventually cause money managers and the public to return to stocks again. It really is that simple. The Fed tightens too much and then slashes rates to get the economy going again. Read the late Martin Zweig’s classic book.
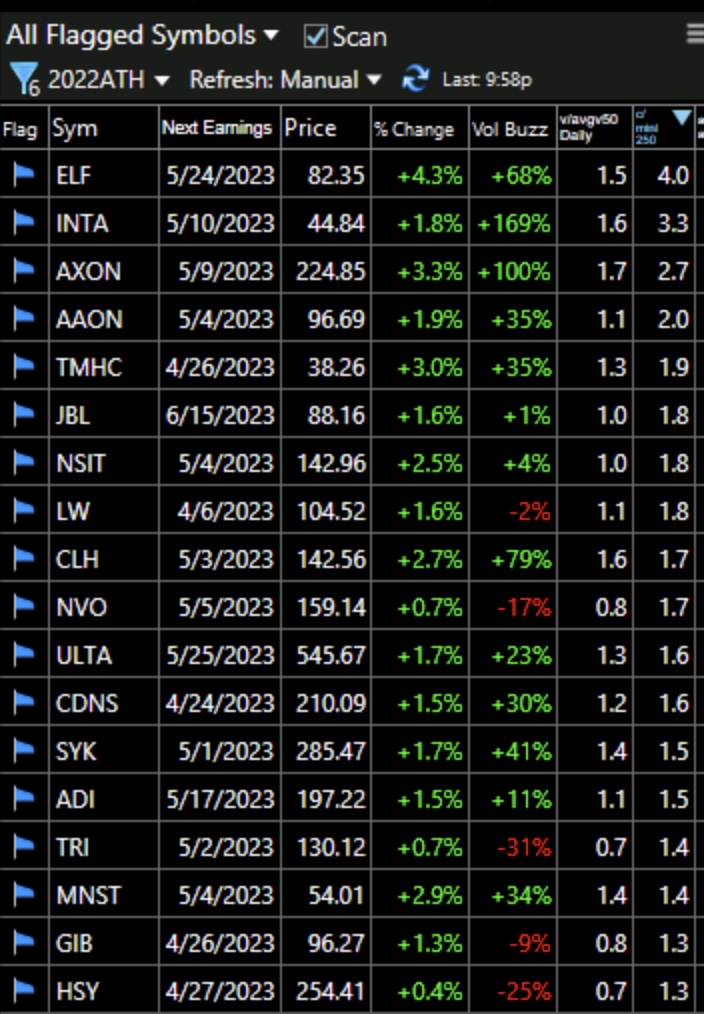
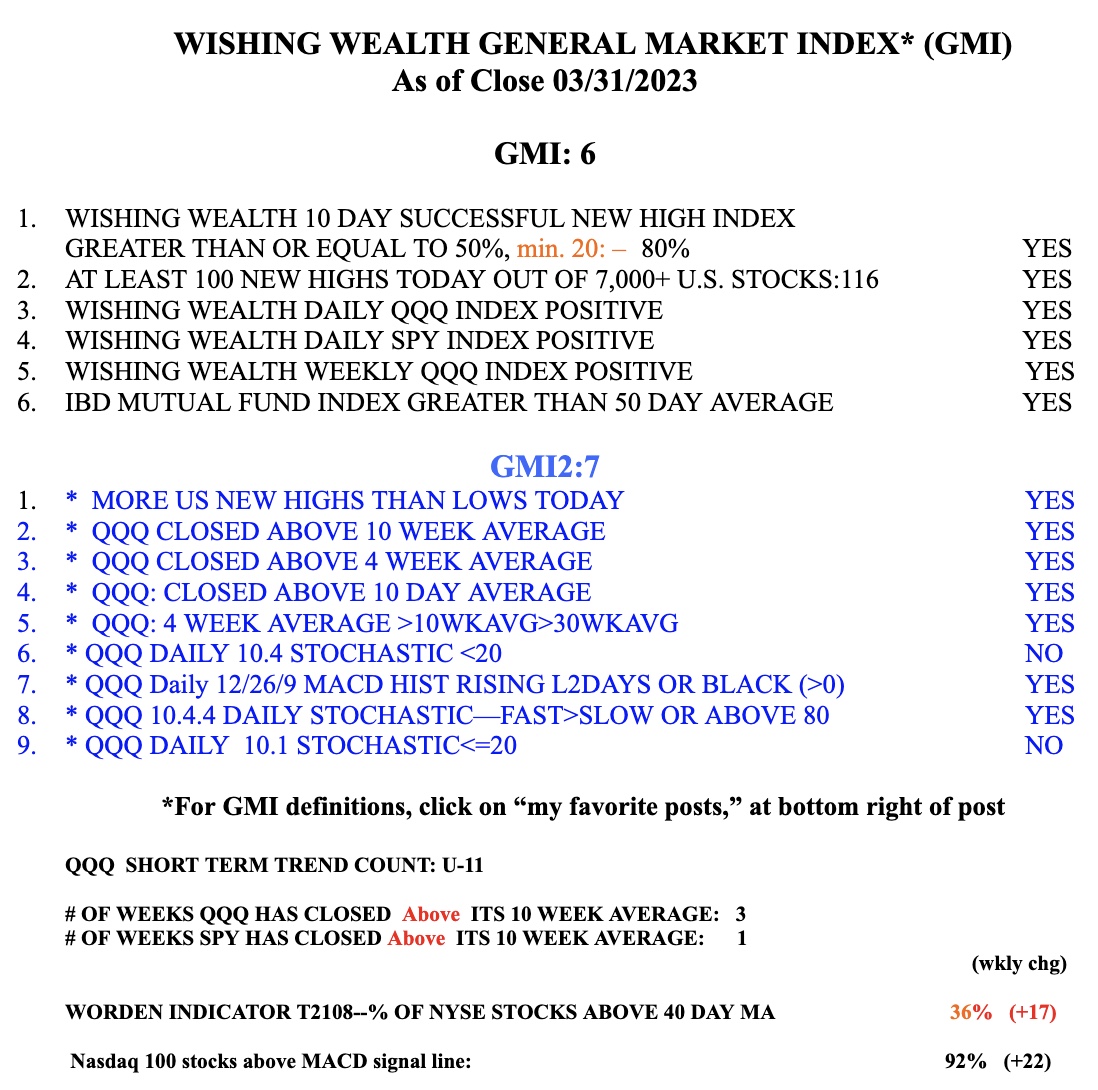
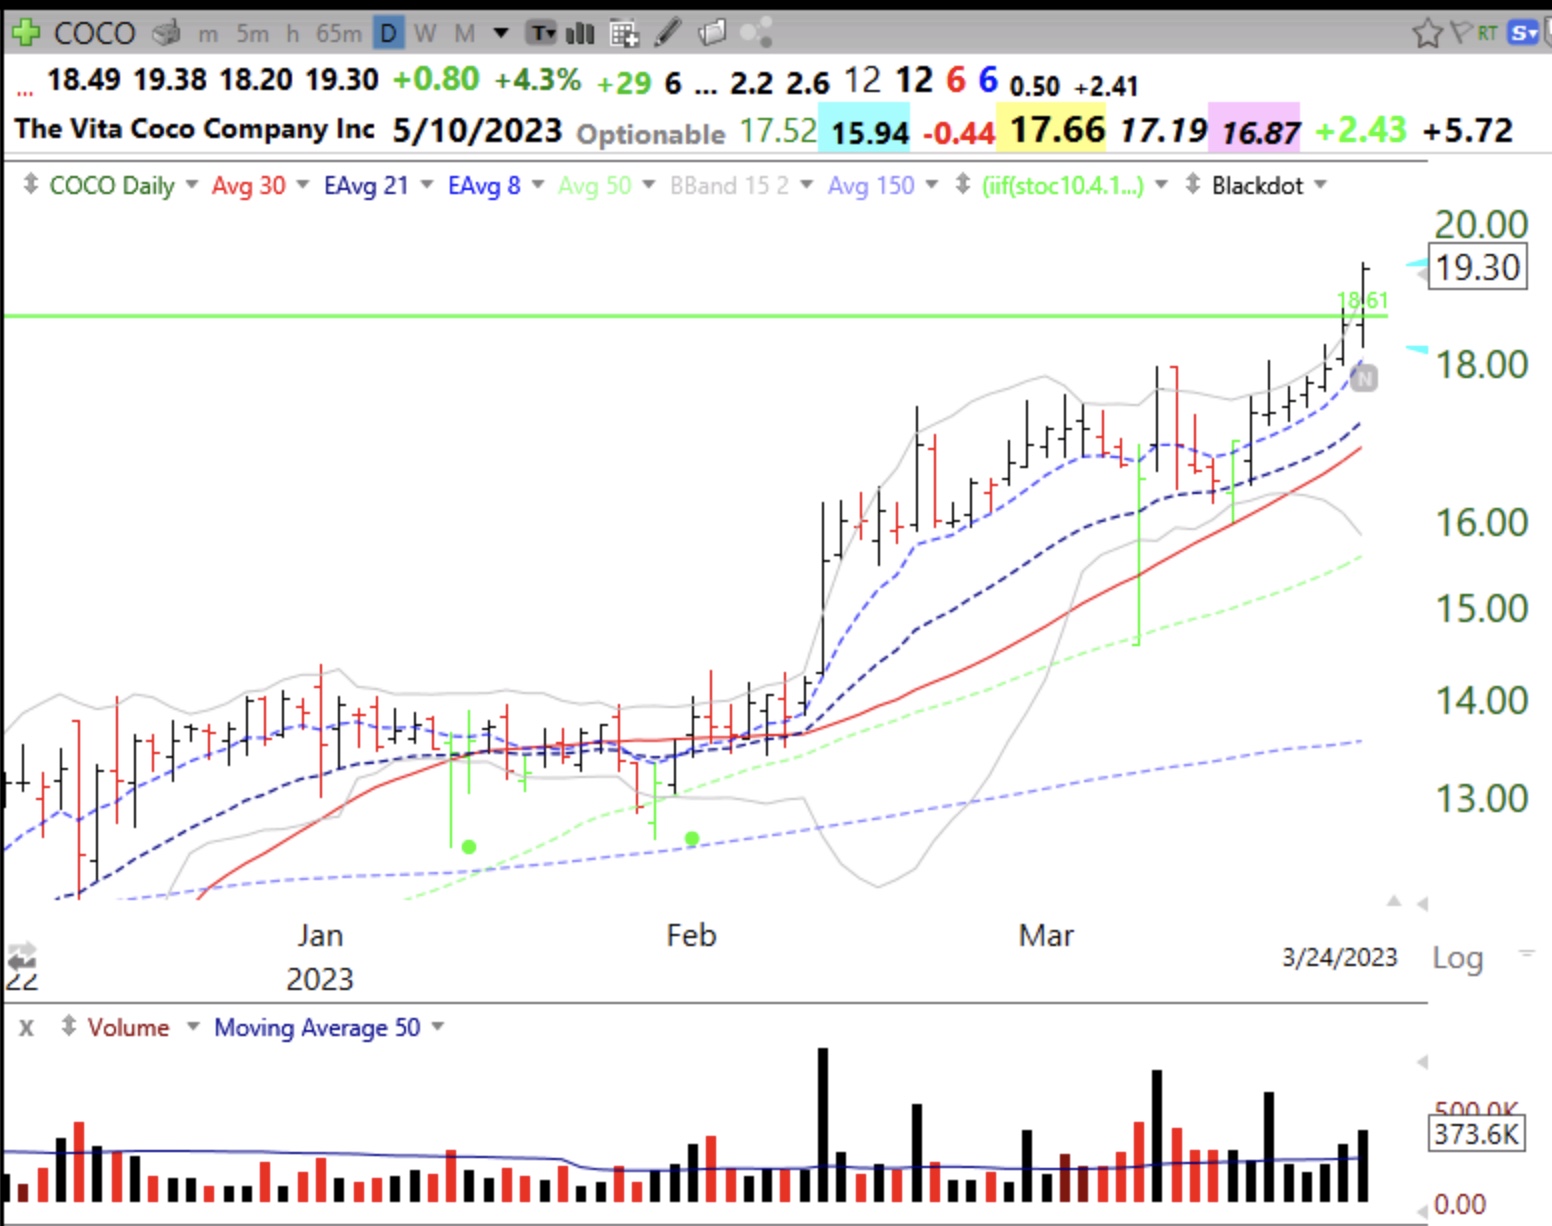
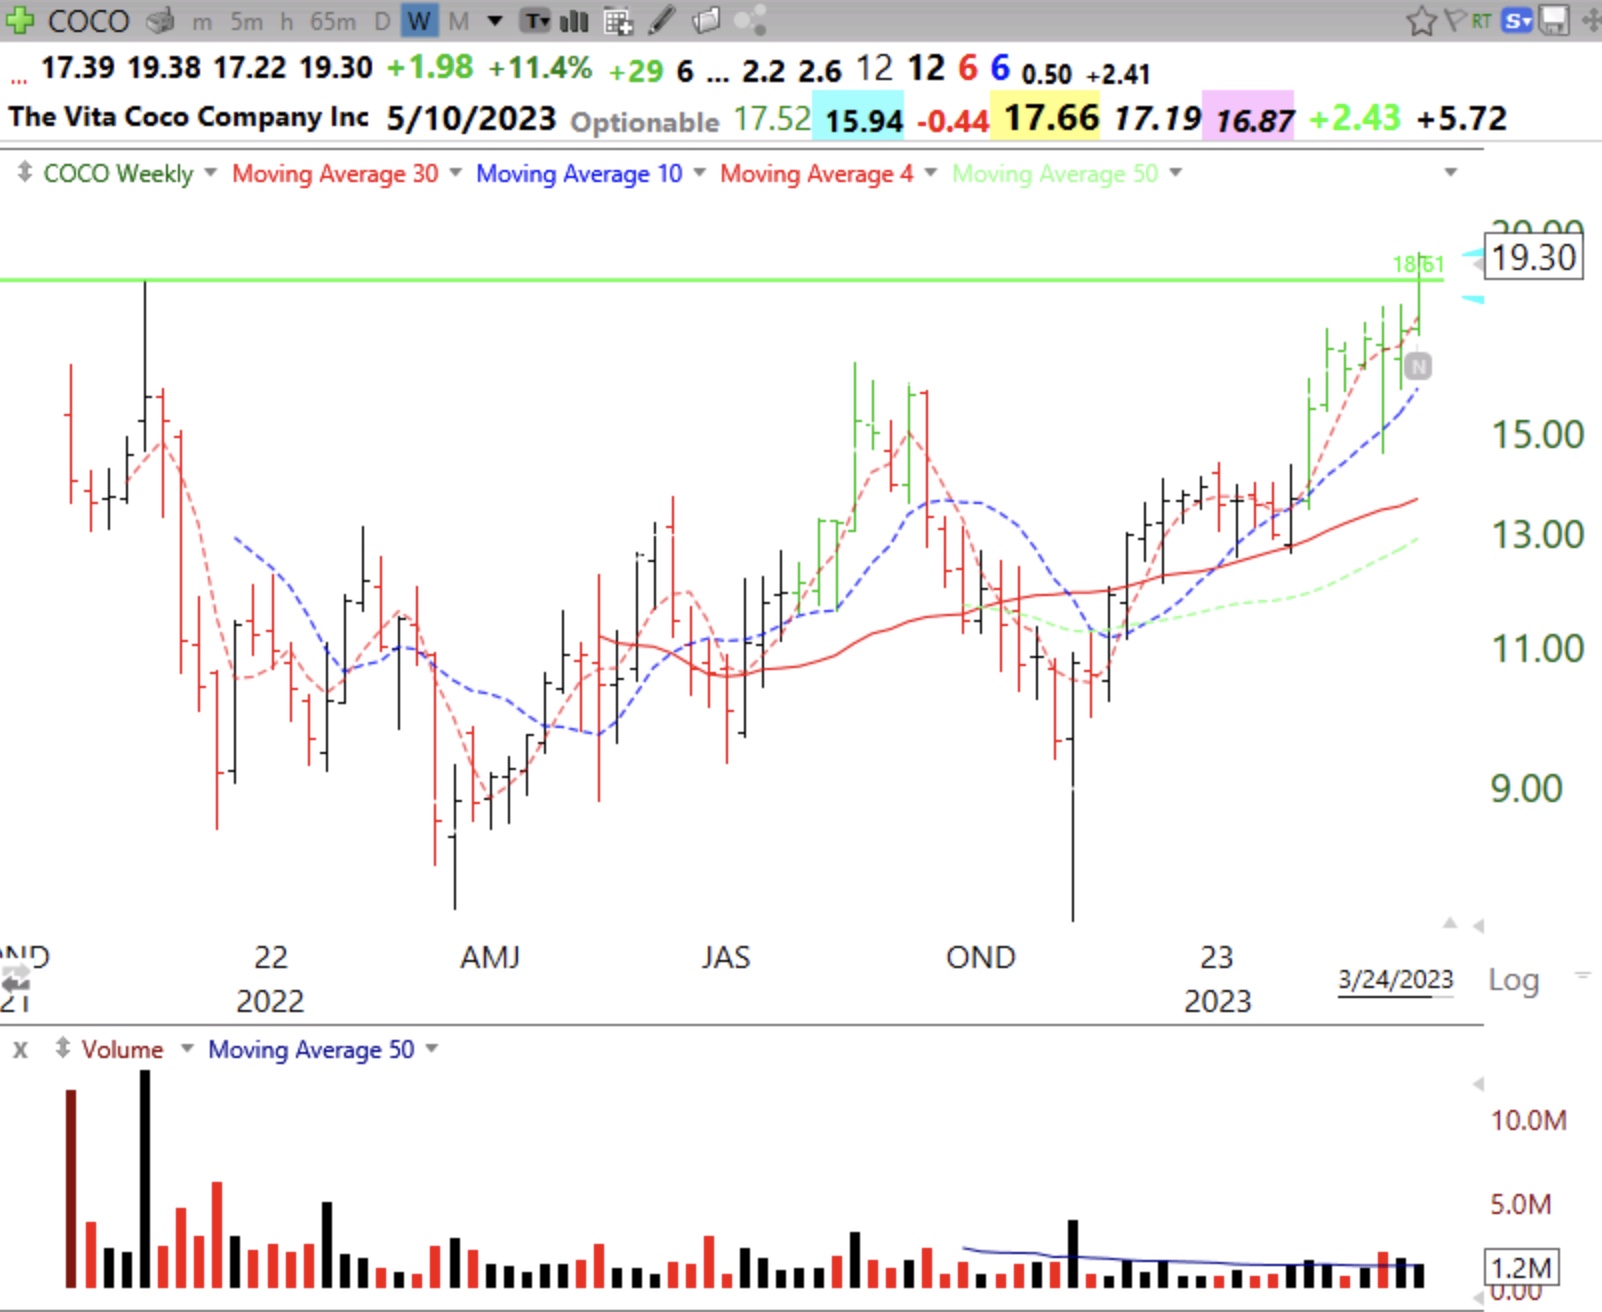
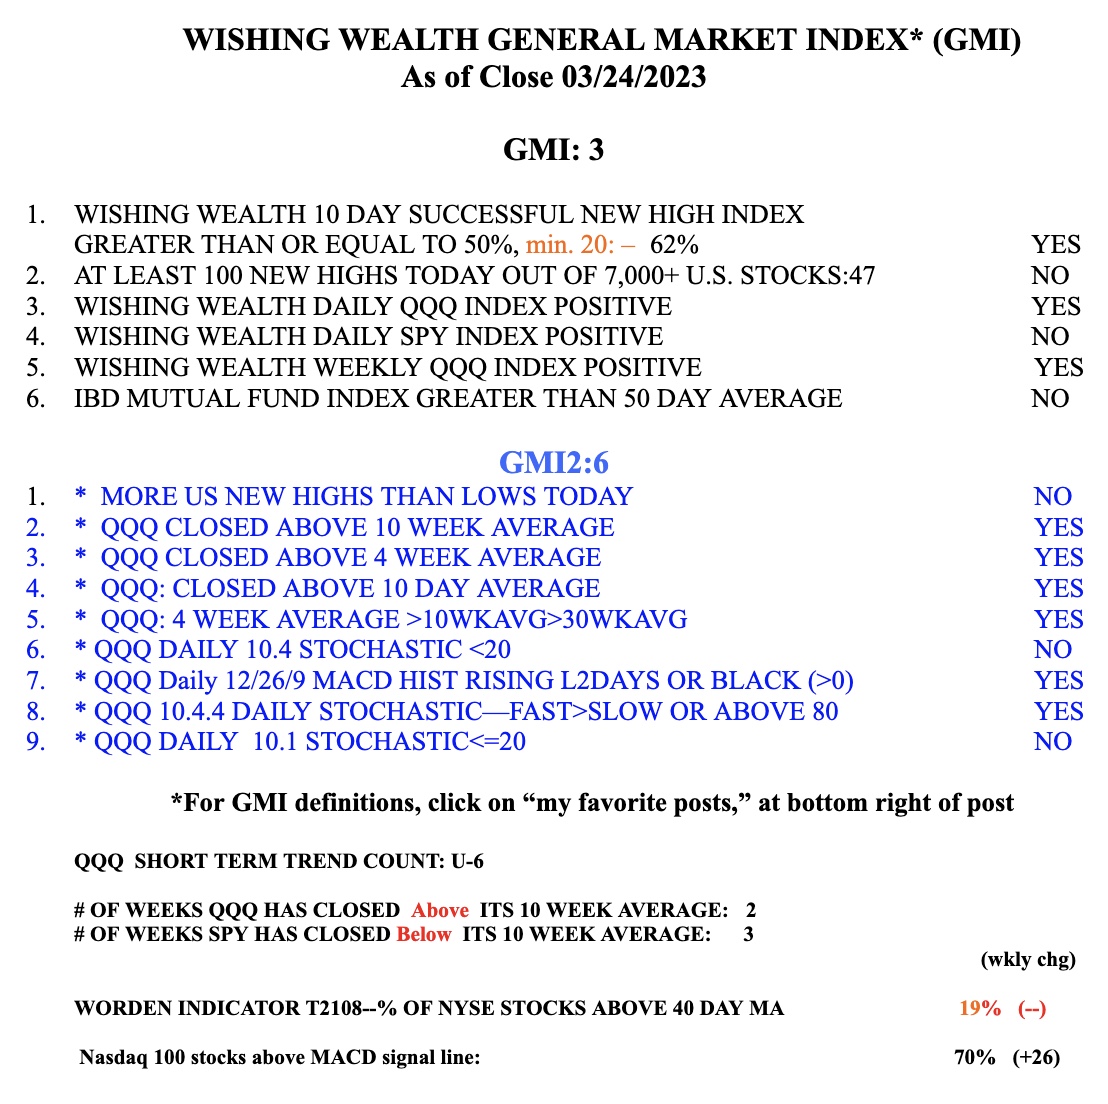
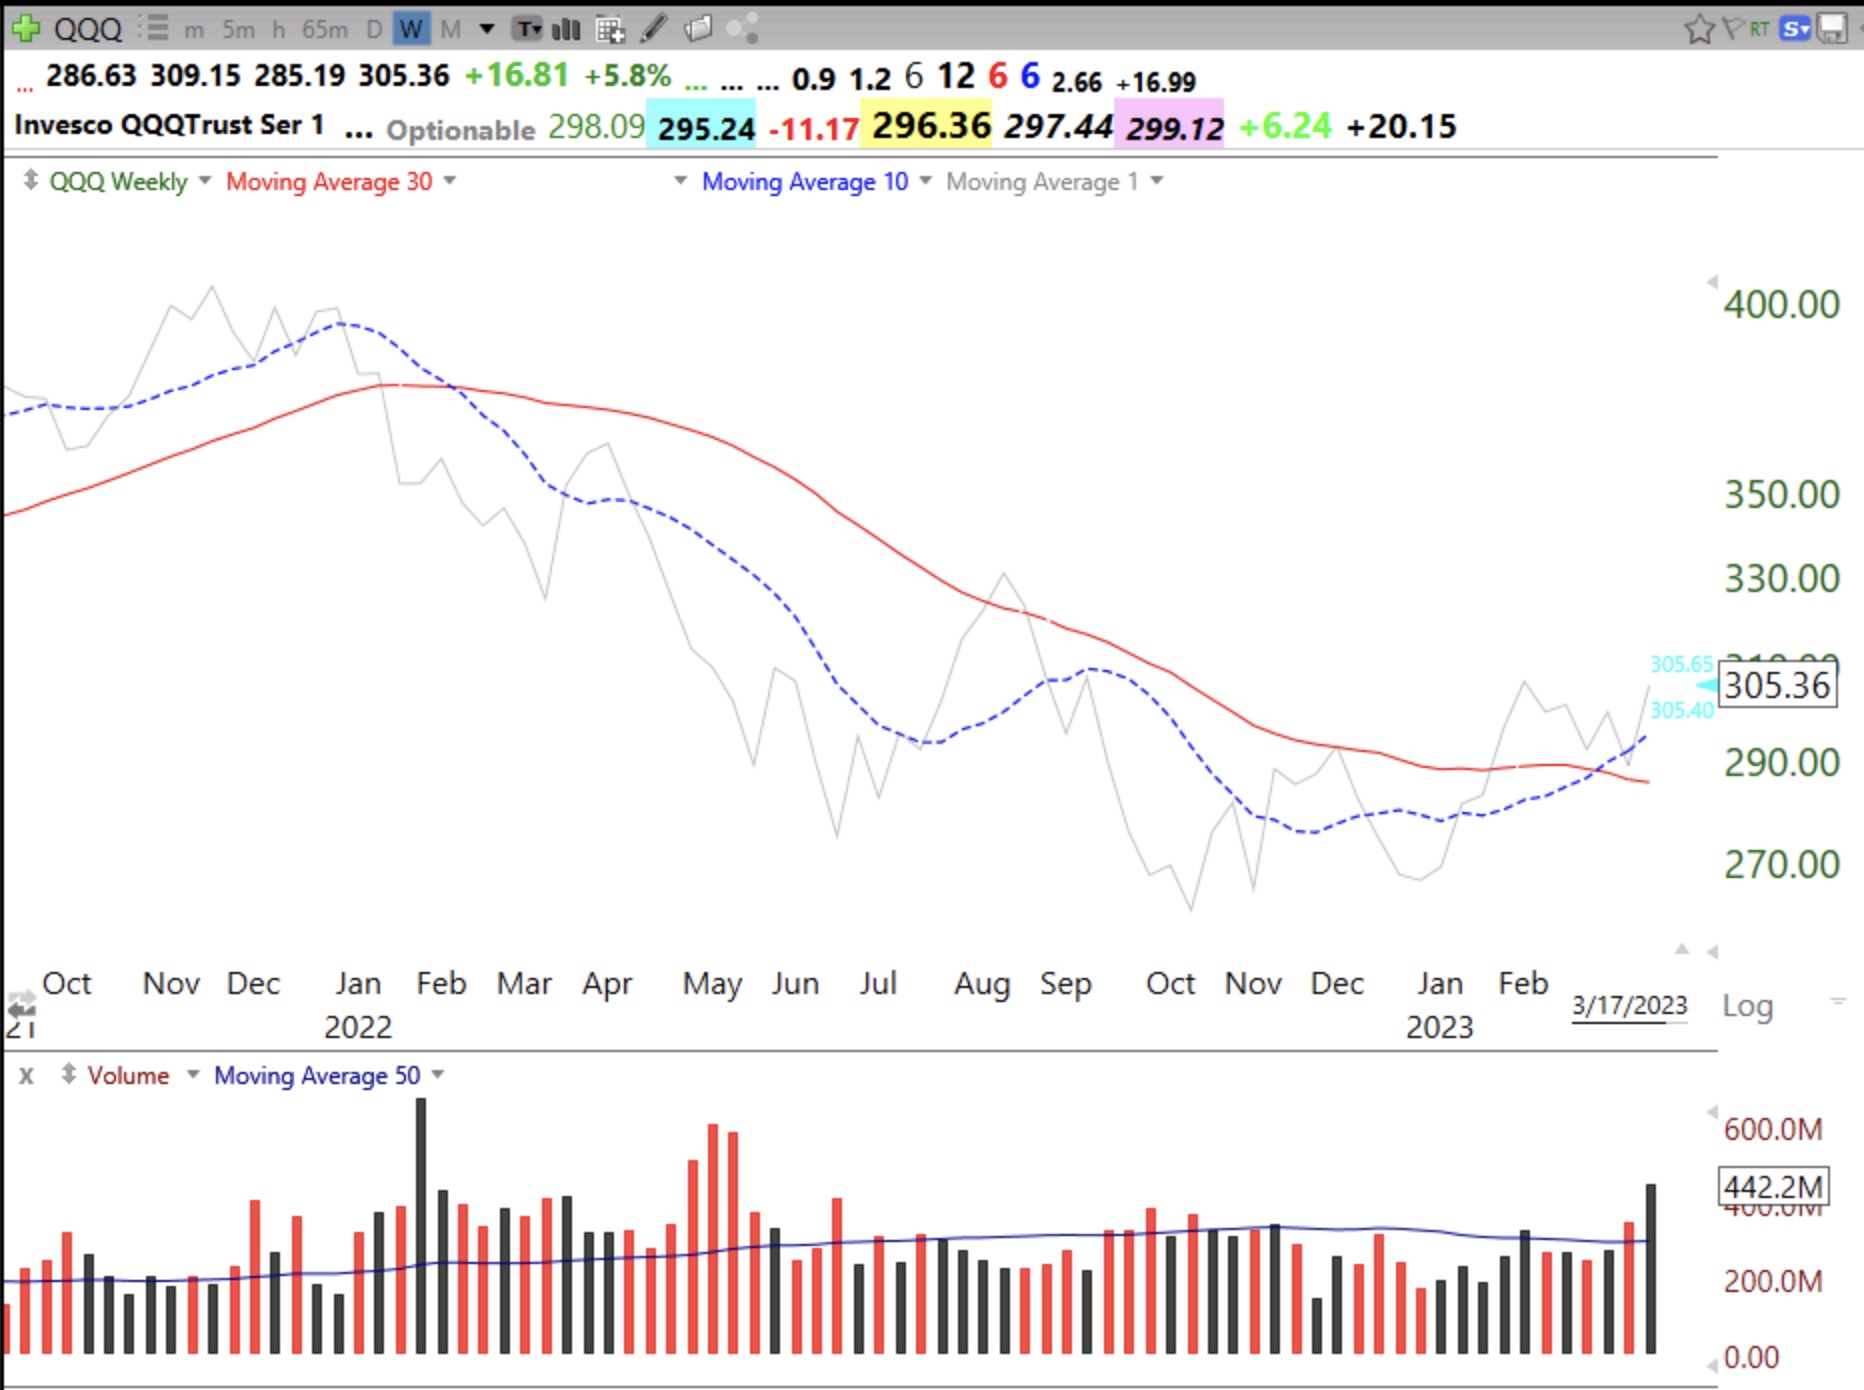
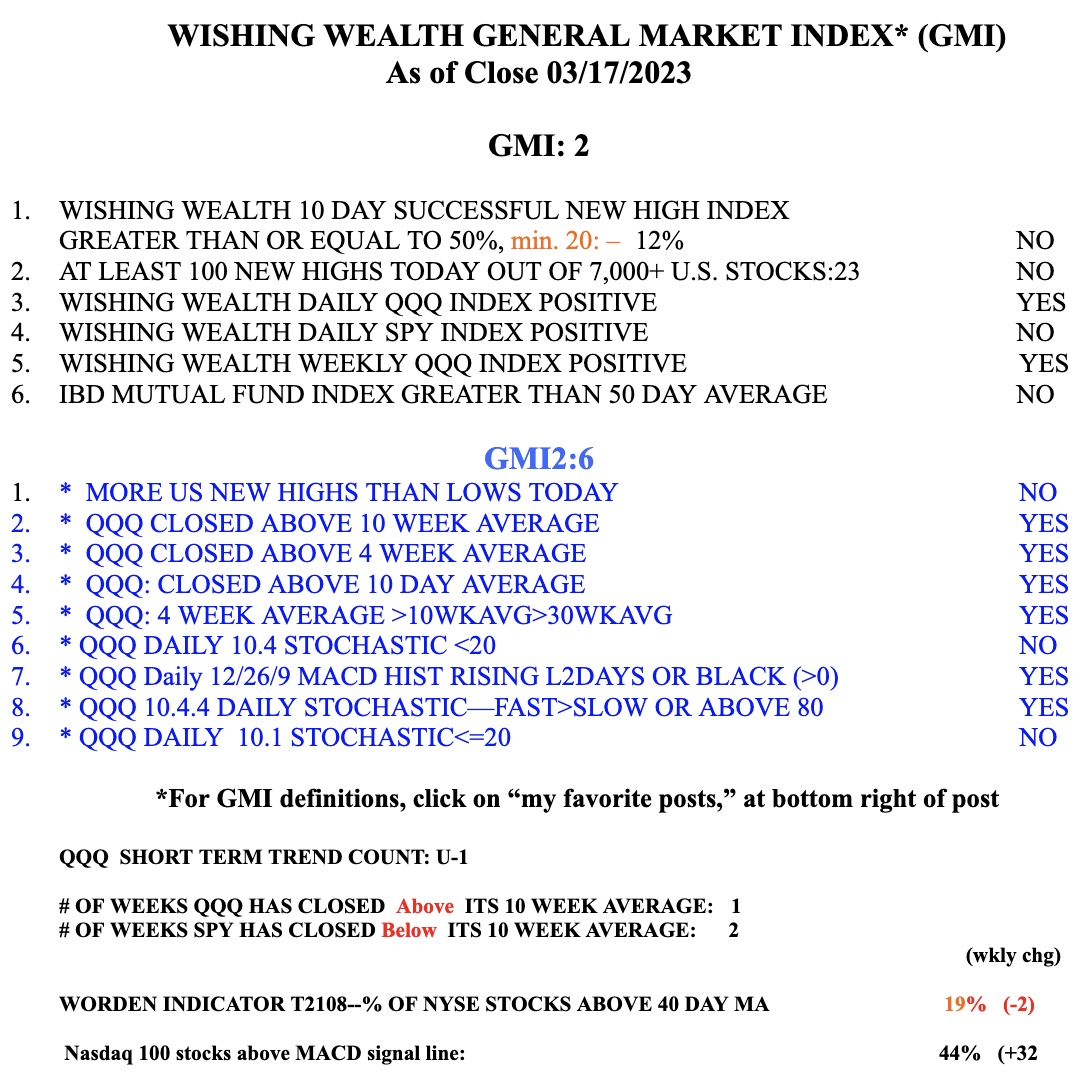
In addition, my GMI (see table below) has now gone to the maximum value of 6. I protected myself from the 2022 decline and am now ready to move back into equities. In my university pension I have begun to transfer out of money market funds and back into mutual funds. In my trading IRA I will begin to buy ETFs and a few growth stocks. I only buy stocks that are above their last green line and trading near their ATHs. The great winners bought by Darvas and O’Neil were stocks going to ATHs. I do now want to buy fallen angels that are turning up or building bases. If they can make it back to ATHs I will consider them. Any stock that can come through 2022 at an ATH is showing incredible relative strength and proof of buying by the big boys. On Friday, there were 18 stocks on my watchlist of stocks recently appearing on IBD/MS lists that traded at ATHs. (I omit cheap or low volume stocks.) This list contains possible market leaders and bears (bulls) watching. (I own some.)
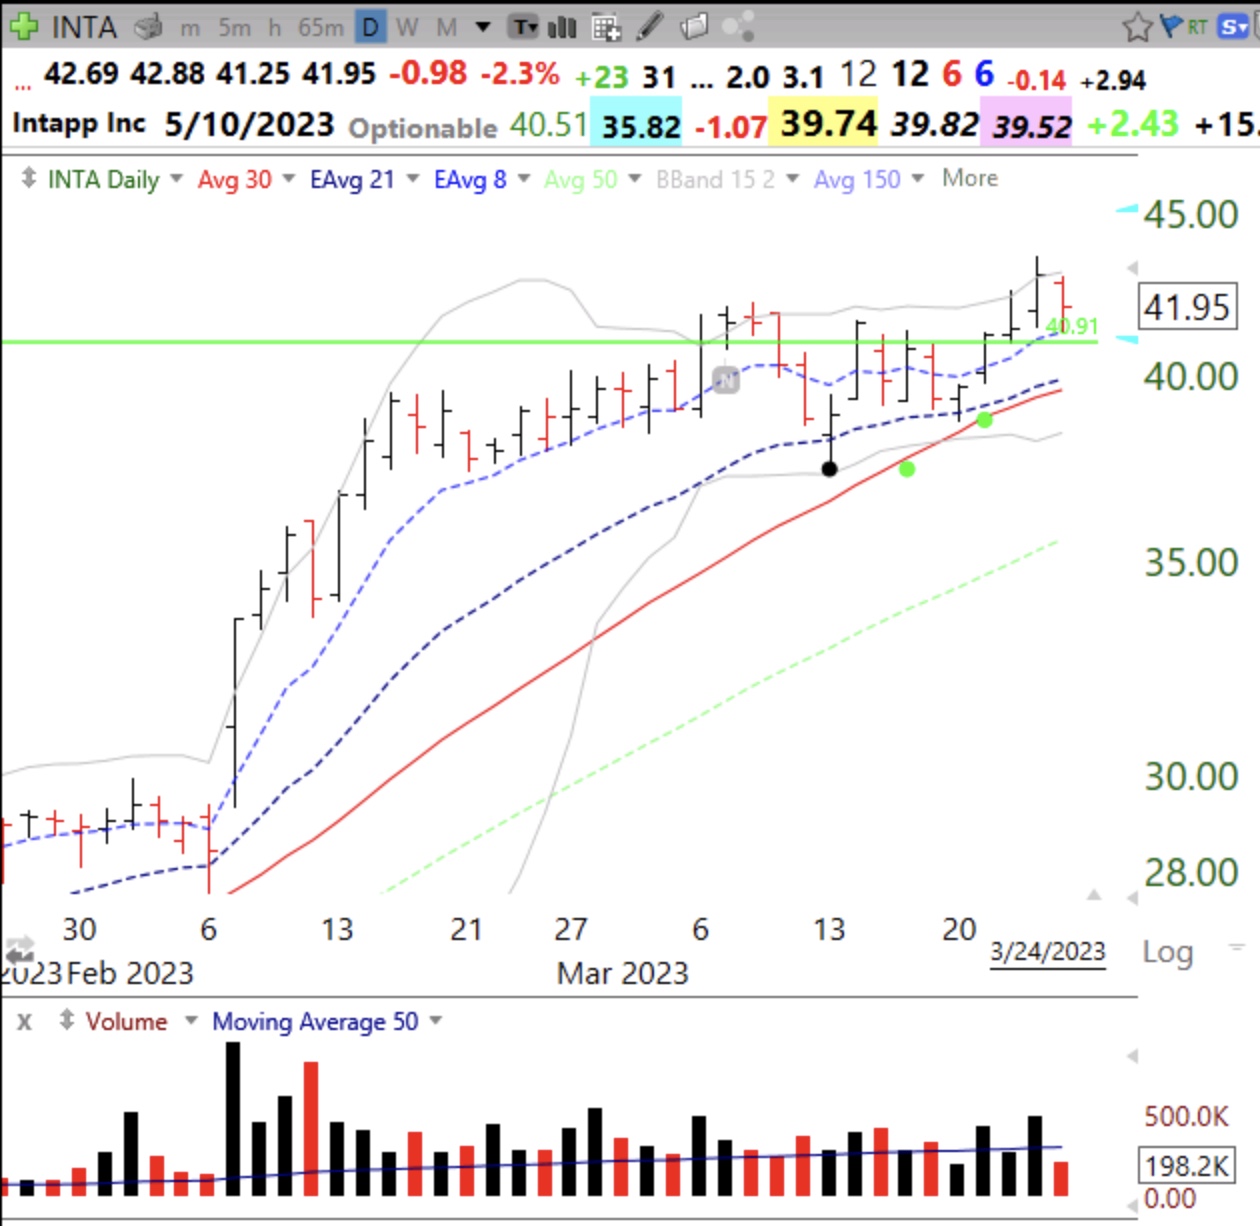
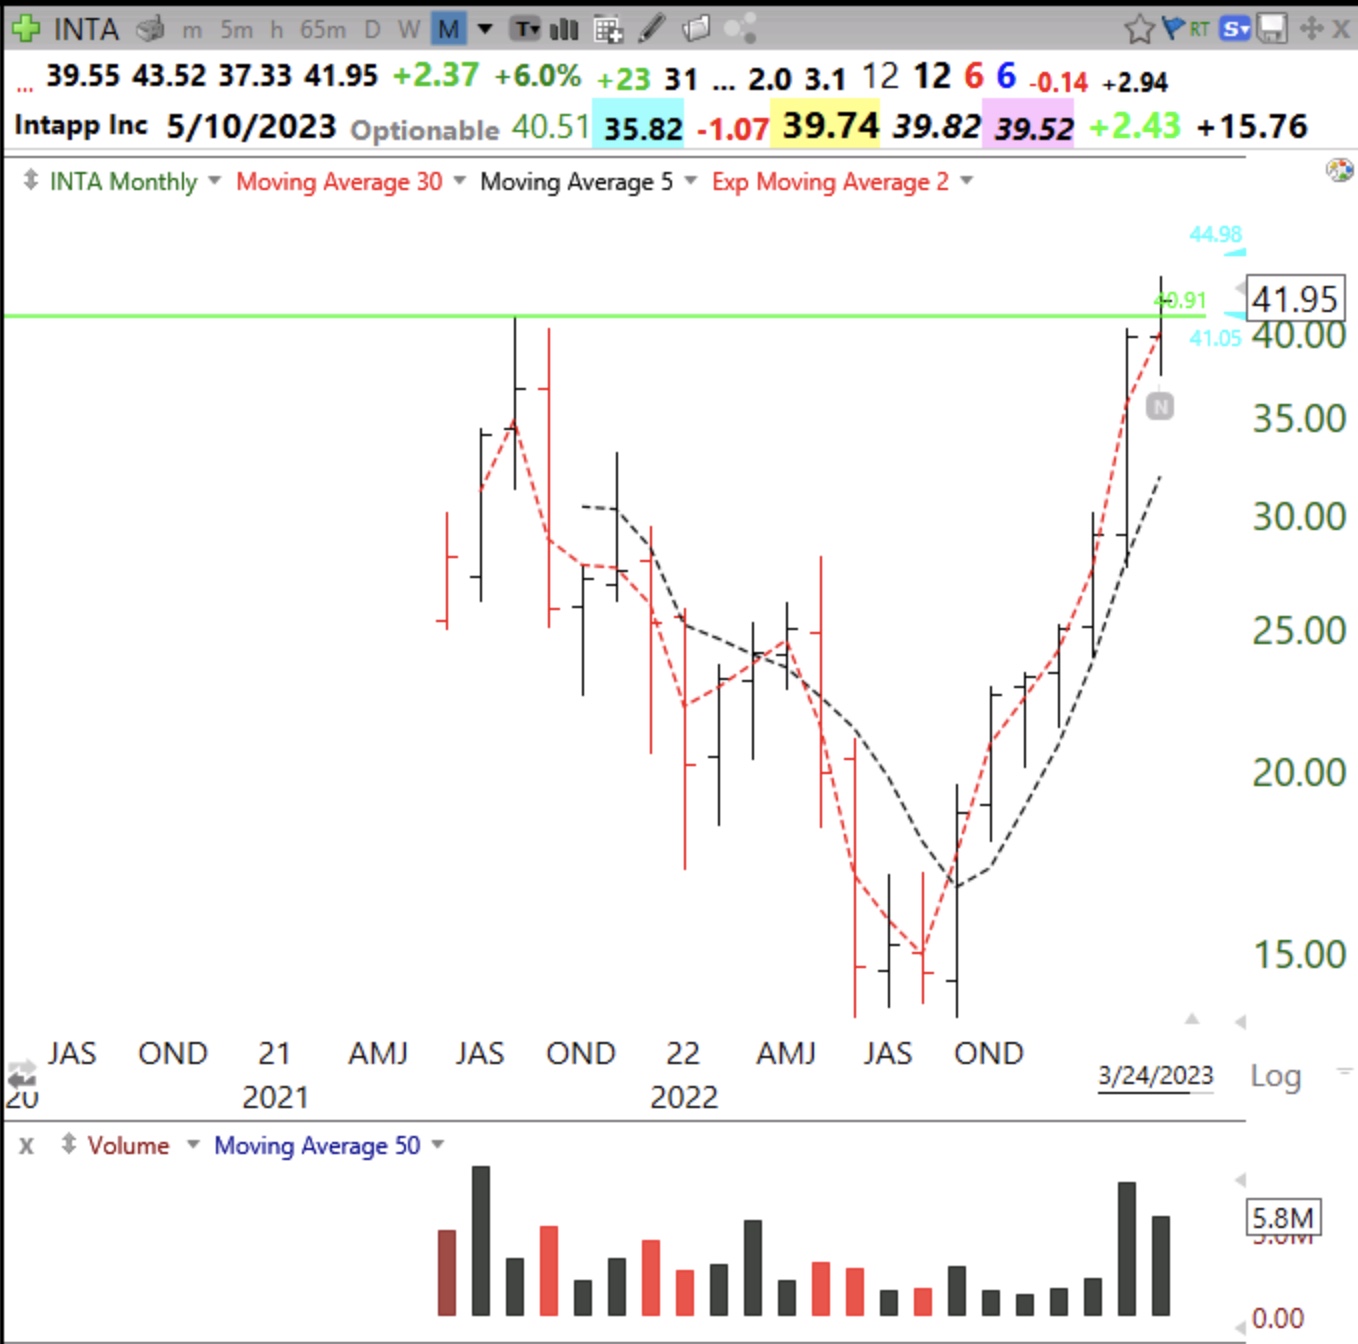
The list is sorted by the last column, Friday’s closing price divided by their lowest price during the past 250 days. Thus, ELF has the highest value of 4.0. Any stock that is hitting an ATH and is trading 4x higher than its yearly low is worth considering. So is INTA, at 3.3x, a recent IBD New America stock, which I wrote about last week. Remember, both Nicolas Darvas and O’Neil’s protege, David Ryan, preferred buying stocks that have already doubled. I want to jump on rockets that have been launched and are heading to the moon, not those close to the earth. Note also the next earnings date column for each stock.
Last week was the end of the quarter when mutual funds dress up their portfolios with the strongest performing stocks. Their end of quarter reports will then show them owning the winners, but do not state when they purchased them. So they look like smart investors to persons reviewing their fund.That is one reason why growth stocks did so well last week. With earnings season coming up we are likely to see more advances. However, remember we are also approaching the Sell in May period which will coincide with the debt ceiling battle. There may be an opportunity to increase positions during this summer’s hysteria. For now, I am following my market indicators. See the GMI table below.