Blog post: Day 5 of $QQQ short term up-trend; GLB–$NAVI; beware September

GMI6/6
GMI-27/9
T210852%

Daily chart shows that NAVI broke above its green line top on above average volume on Friday. It is 2.6 times its price a year ago.

Monthly chart shows that NAVI peaked and formed a green line top  in December, 2014.

Weekly chart shows that NAVI has closed above its 10 week average (blue dotted line) since December 2020. It is a consistent yellow band stock with its 4wk>10wk>30wk averages.

The GMI is at 6 (of 6) and Green. I am still concerned that September could fulfill its reputation as the  worst month for the market. Check out my TraderLion conference presentation listed on the topics/webinars  tab at the top of this blog page.


Blog post: Stocks rally and 2 day old $QQQ short term down-trend may end Monday; $NKE–an example of how I use my latest oversold bounce (OSB) scan to find promising stocks; $QQQ retakes all shorter daily RWB averages

GMI5/6
GMI-24/9
T210833%

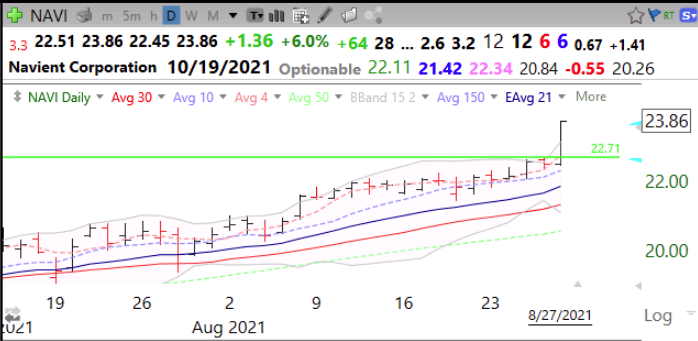
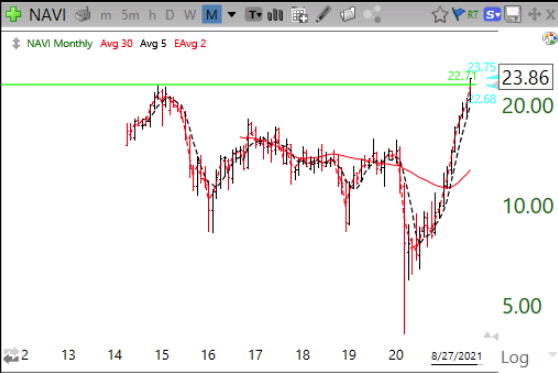
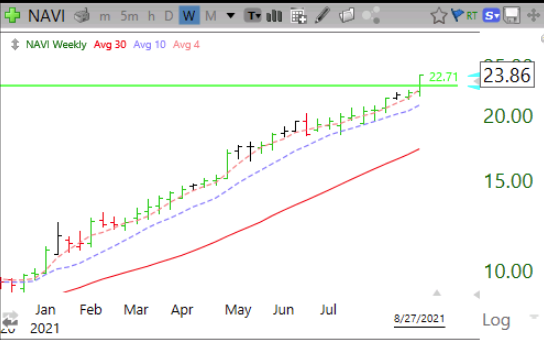
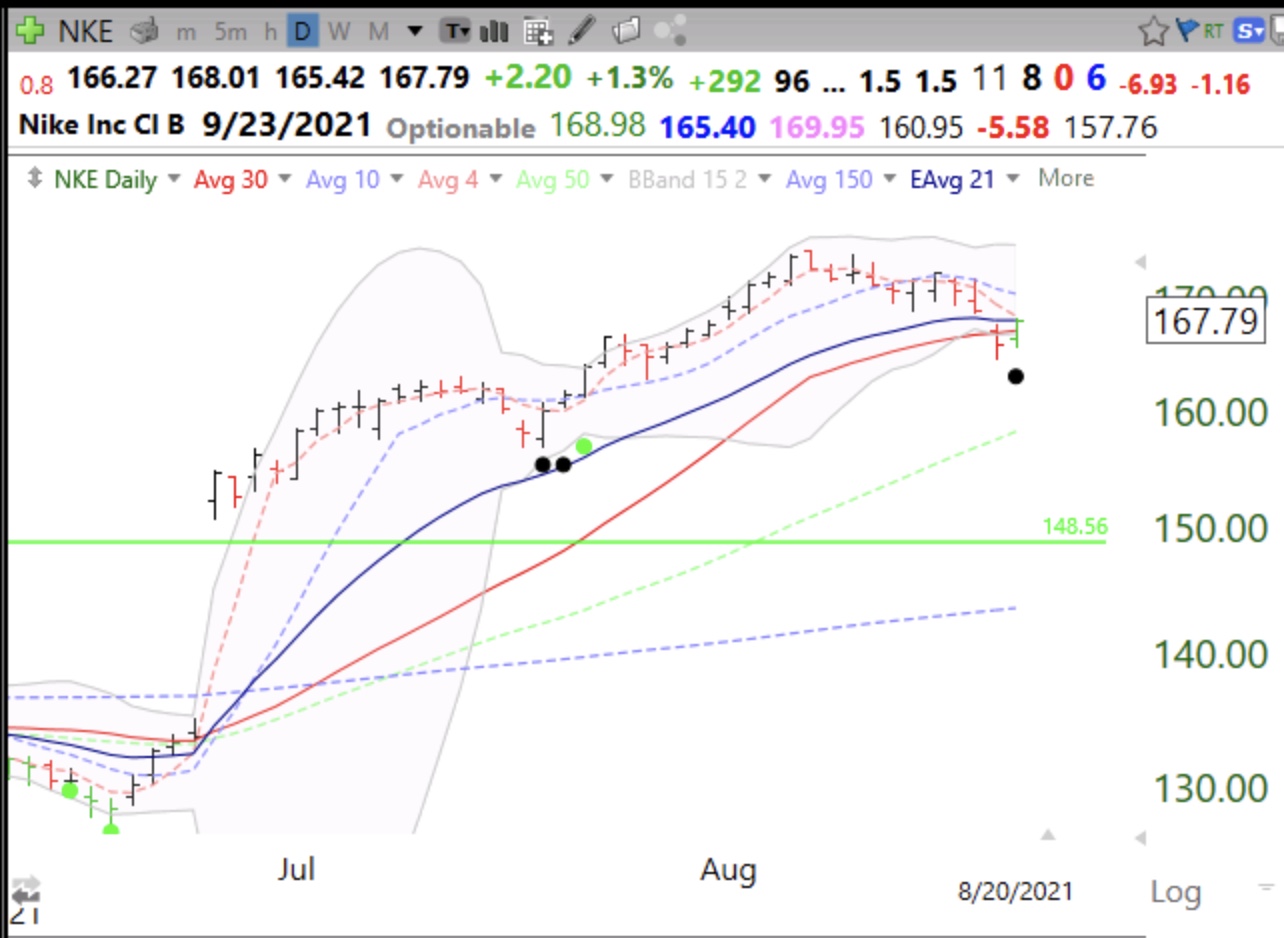
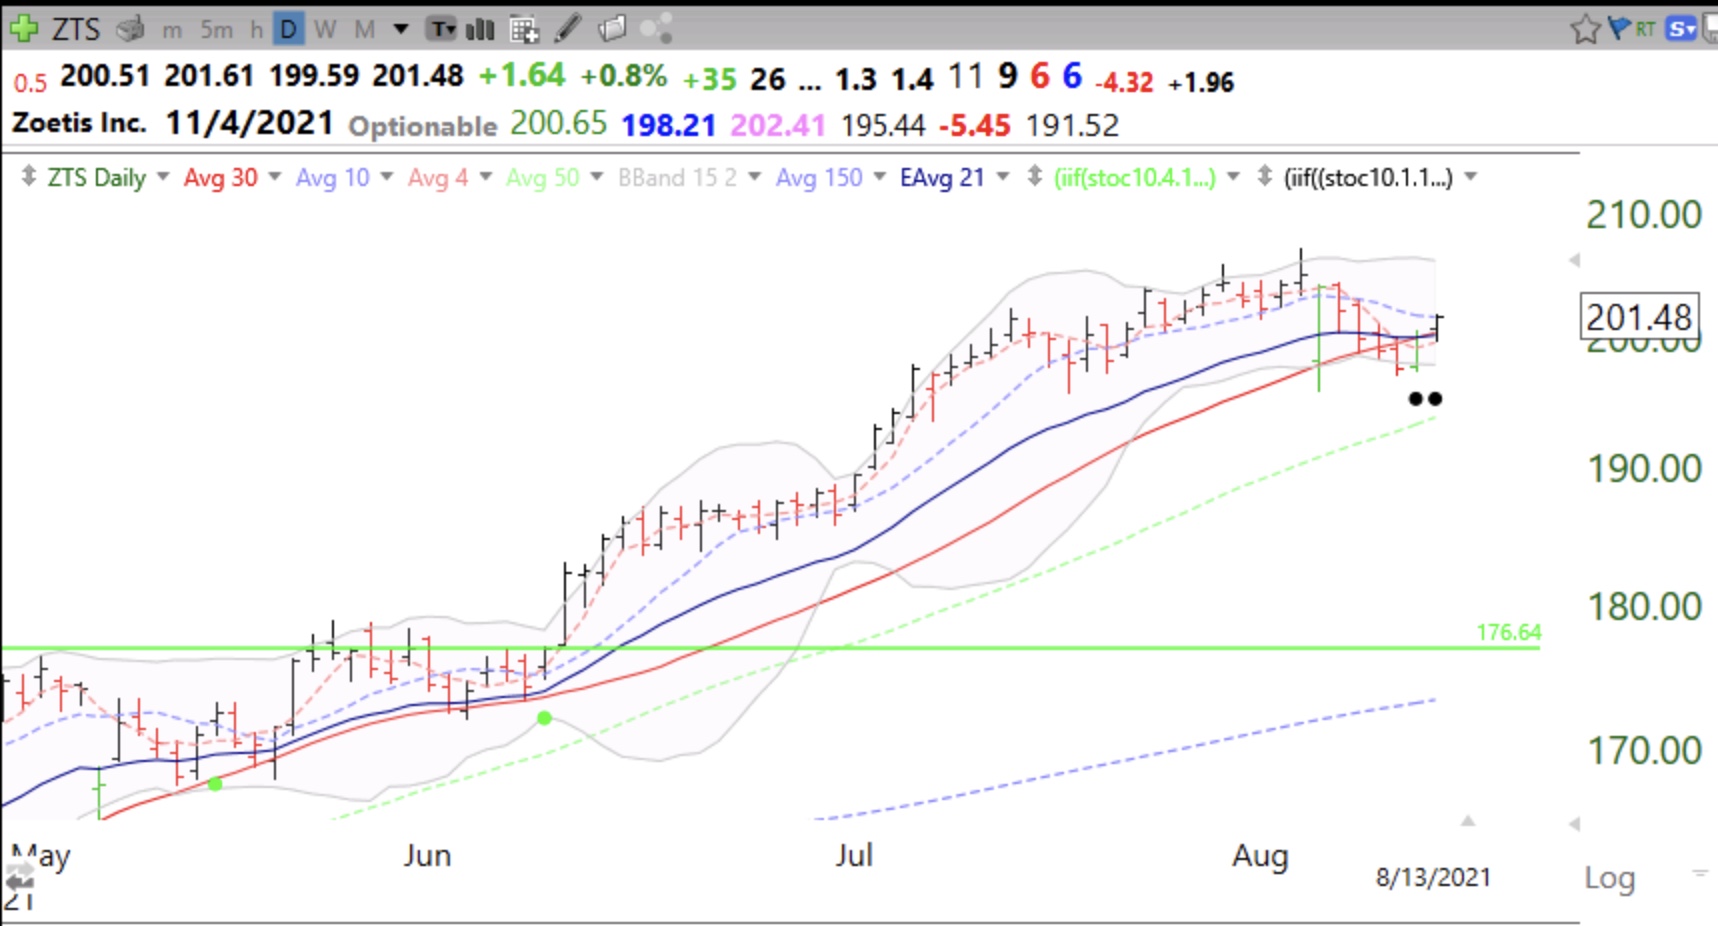
The key to prospering in the market is to have developed a set-up, defined by objective conditions which leads one to expect that a stock will rise almost immediately. The set-up must also suggests a price at which  to set a stop loss to sell out with a small loss if the set-up fails. If the set-up is good, one will likely end up with a lot of small losses and a few big winners that more than make up for the losses. I ran a new scan on the Dow 30 and found that NKE came up. NKE has recently had a green line break-out (GLB) to an all-time-high (ATH). It bounced on Friday from an oversold position. If I bought this bounce I would immediately place a GTC stop order to sell, just below the bottom of the bounce, at 164.67. If the stock trades below this price then the set-up has likely failed and I would quickly exit with a minimal loss. This scan also ensures that all identified stocks are already in up-trends and have recently reached an ATH. Note the black dot signal too, one indicator of being oversold. I do not own NKE. This example is for educational purposes only.

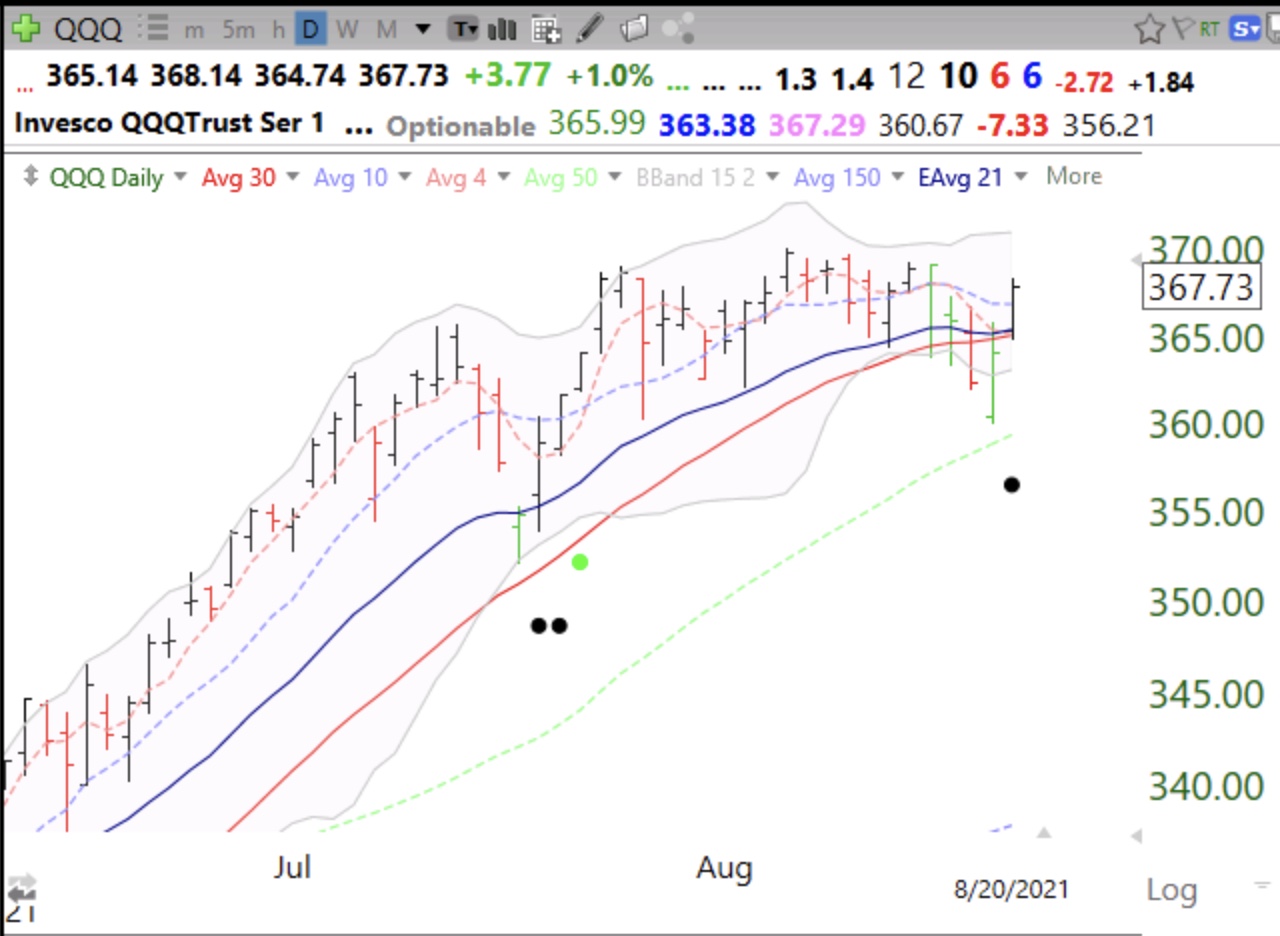
By the way, QQQ also was identified by this scan! Note the recent bounce up off of  the lower daily 15.2 Bollinger band, one component  of this scan.

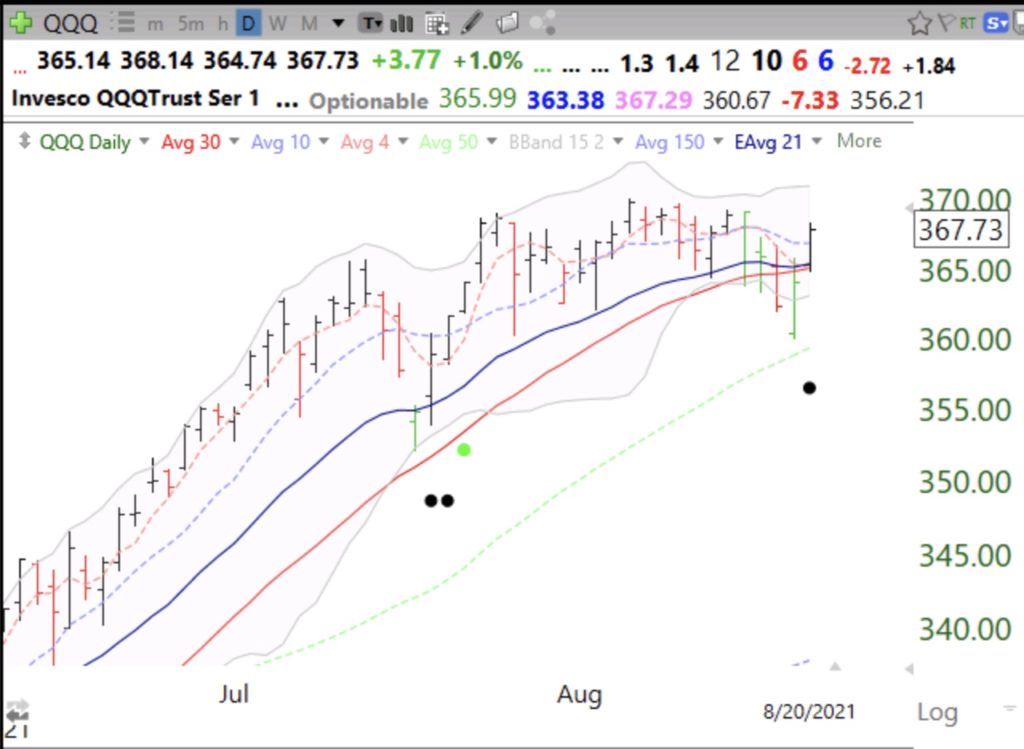
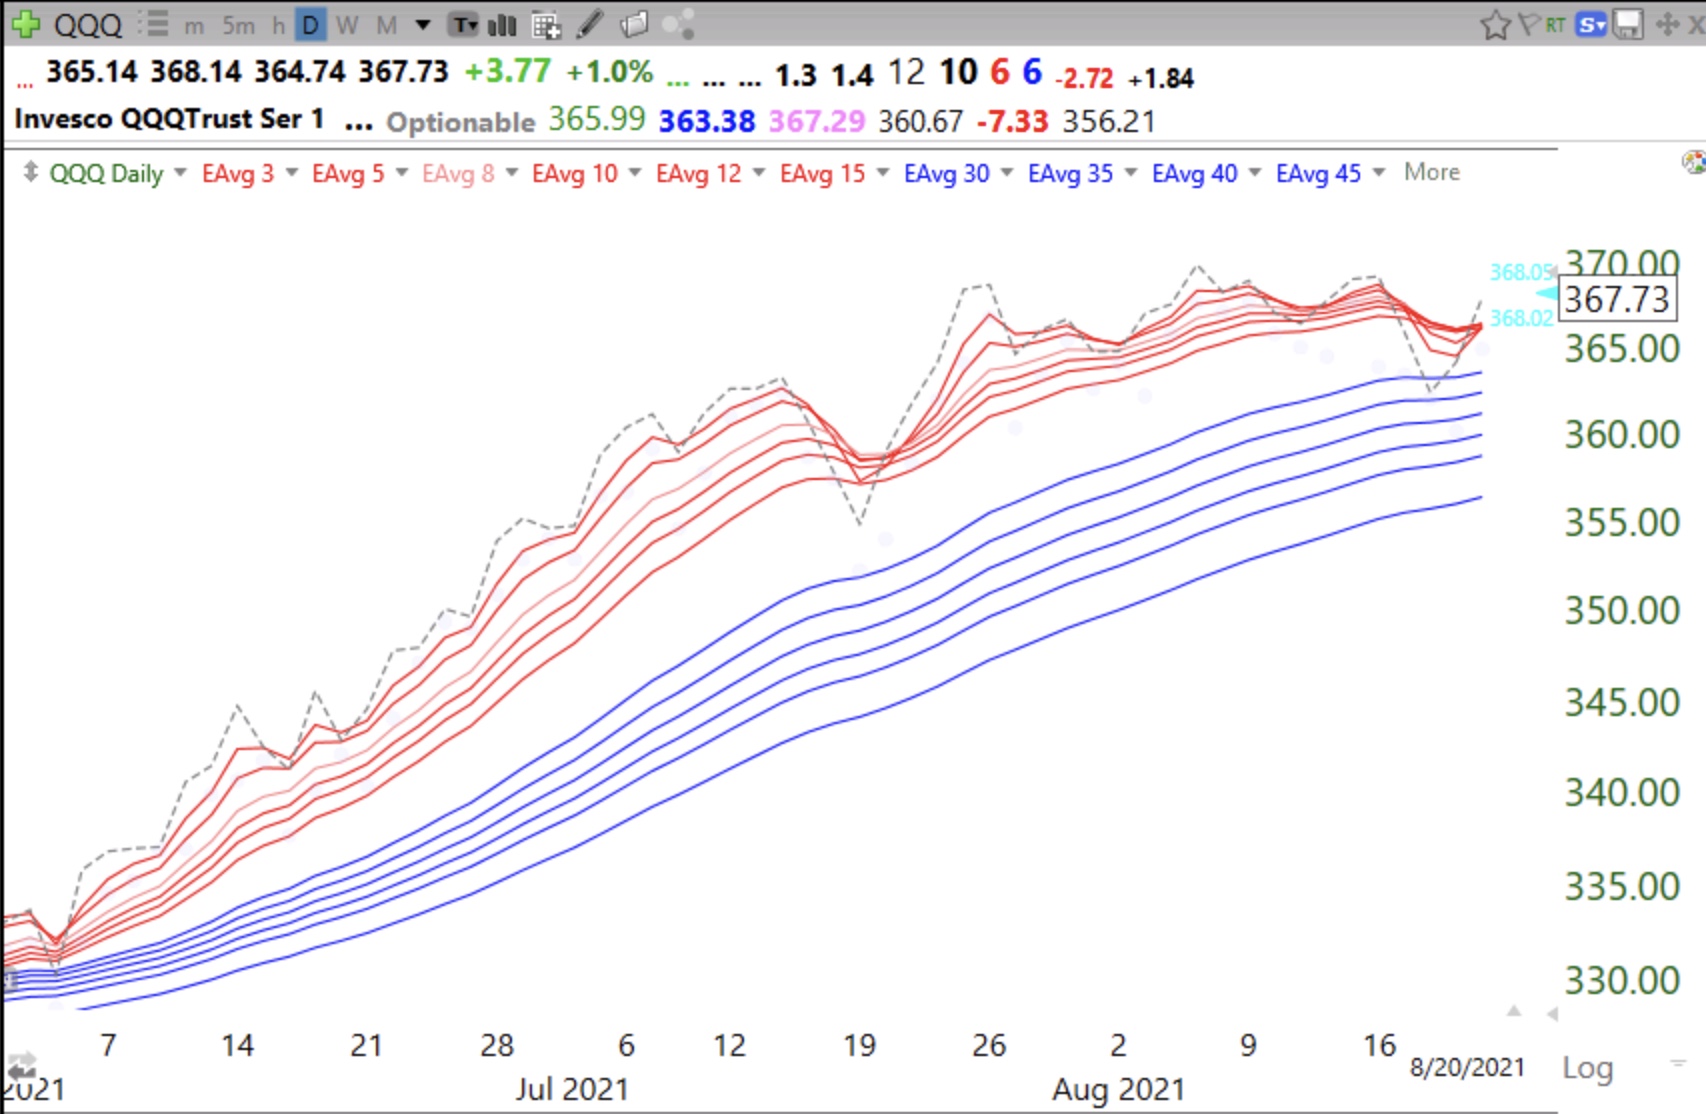
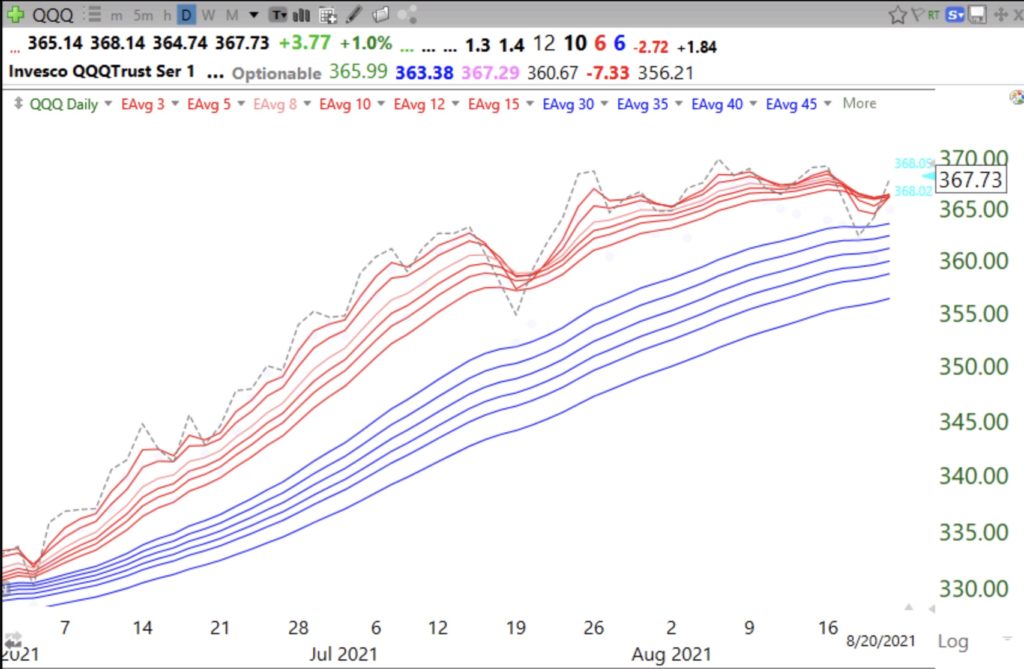
QQQ has also closed (dotted line) back above all of the  short term averages (red lines). Looking to buy TQQQ if it holds.


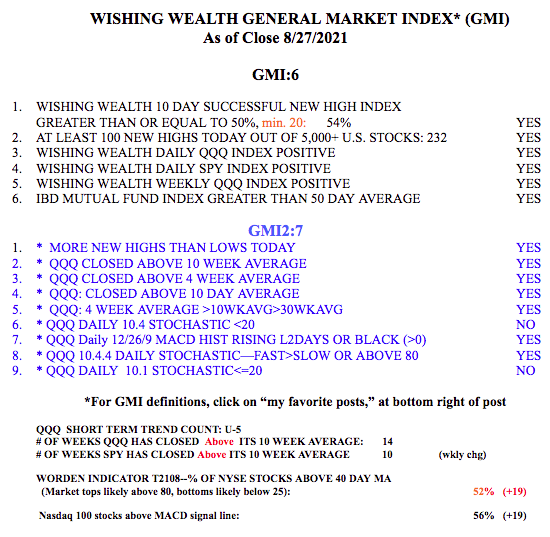
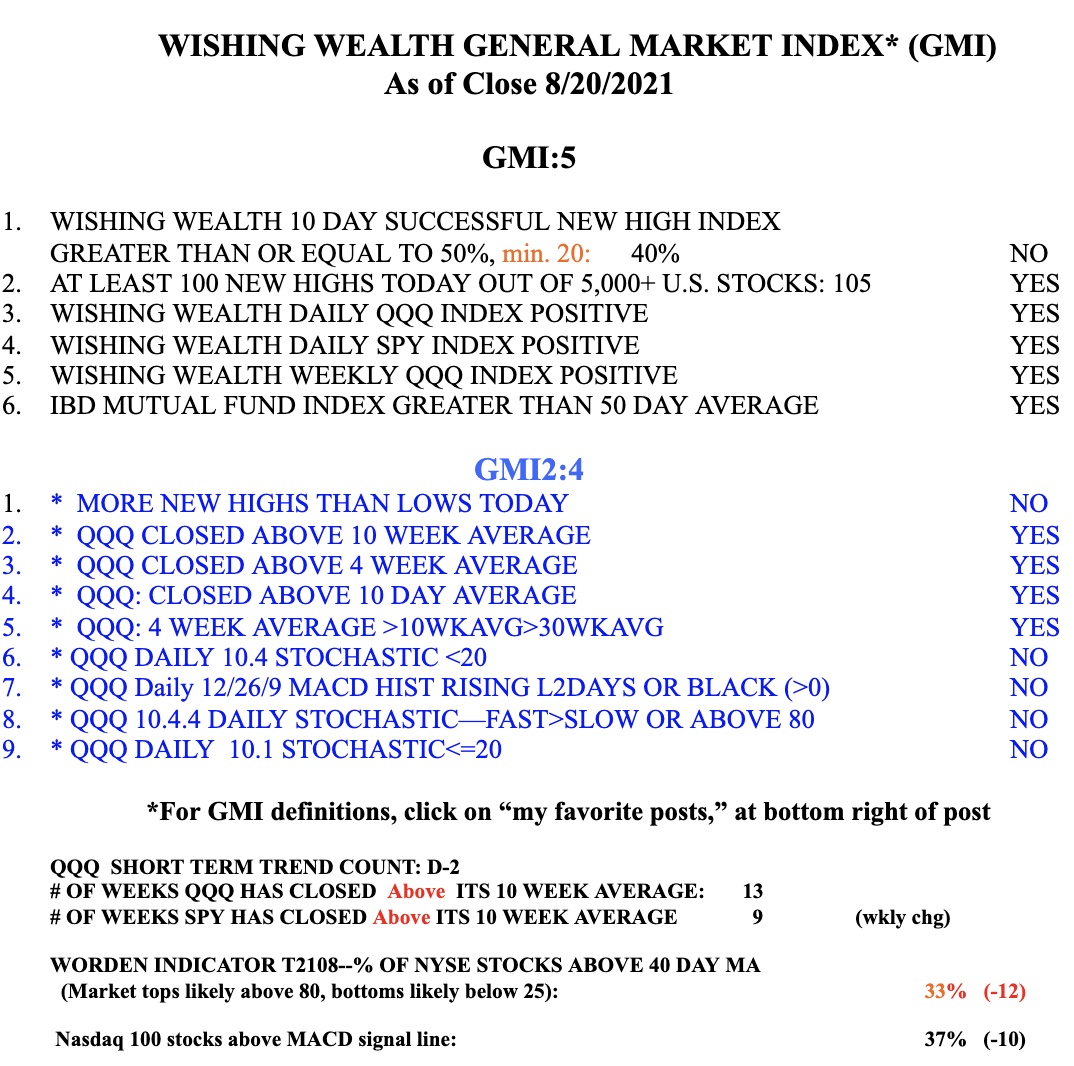
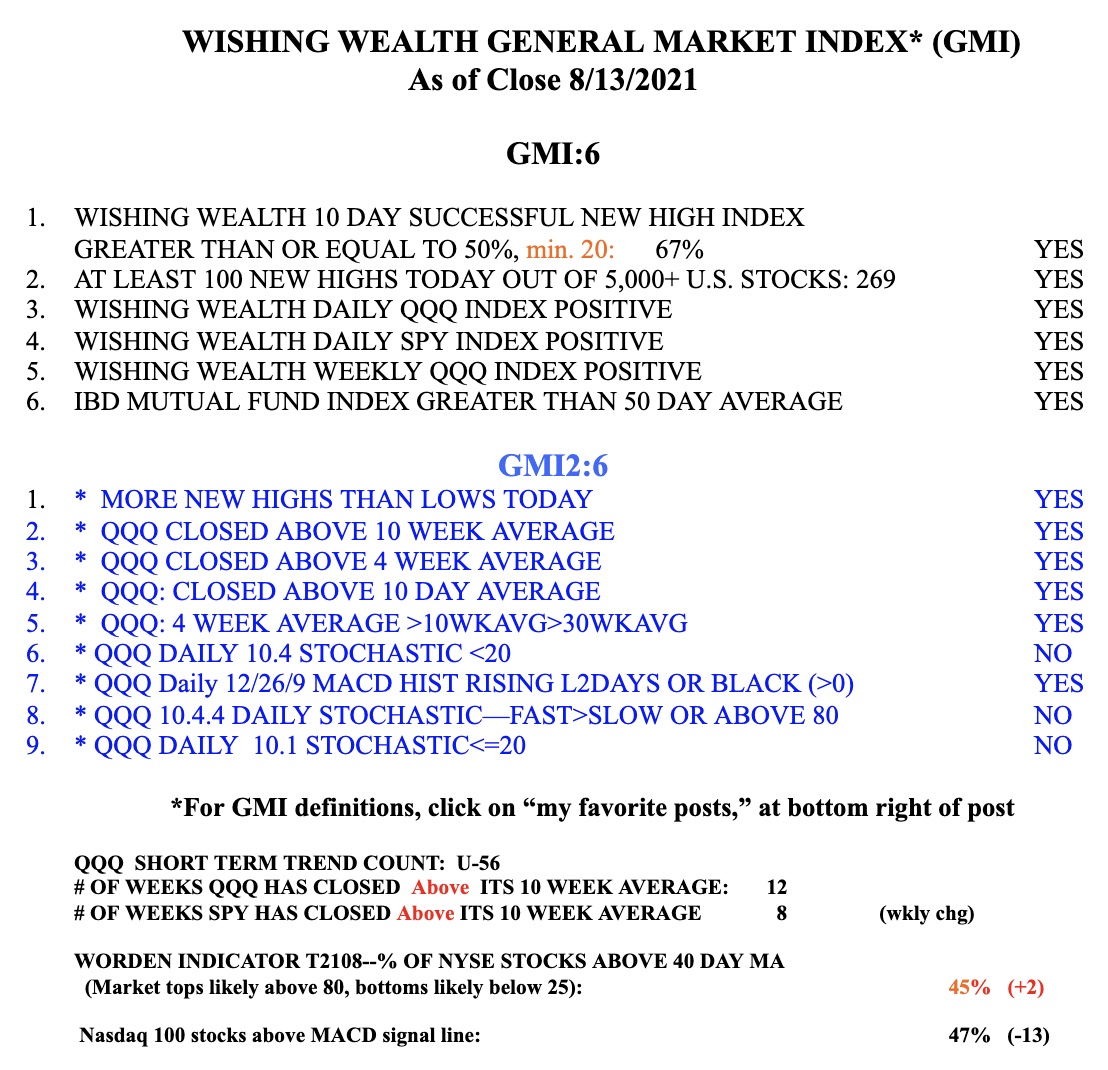
The GMI is at  5 (of 6) and on a continuing Green signal. My shorter term trend indicator, currently at D-2, may change to an up-trend  after Monday’s close.


Blog post: Day 56 of $QQQ short term up-trend; List of 4 stocks from my scan of recently oversold growth stocks now closing above their 21 day exponential moving average–$AVGO, $NOW, $ZTS, $IQV

GMI6/6
GMI-26/9
T210845%

All 4 stocks are in up-trends with 10wkavg>30wkavg and above $150. These stocks traded below their bottom 15.2 daily Bollinger Bands anytime in the last 7 days and now are above their exponential 21 day averages. Check out their daily and weekly charts. If I bought any I would sell immediately after a likely close below that moving average or the lower Bollinger Band. As an example, here is the daily chart of ZTS. Note its GLB (green line break-out) in June and the black dot signals. An alternative place for a stop would be below the low of the bounce day, around 196.96. Remember new traders, you can buy one share and only risk about $5. You have to learn how to manage your losses.


The GMI is at 6 (of 6). QQQ has closed above its 10 week average for 12 straight weeks. I still fear the coming month of September and remain very cautious.