Market indexes are taking off–Stage II, long this market

GMI6/6
GMI-26/9
T210854%

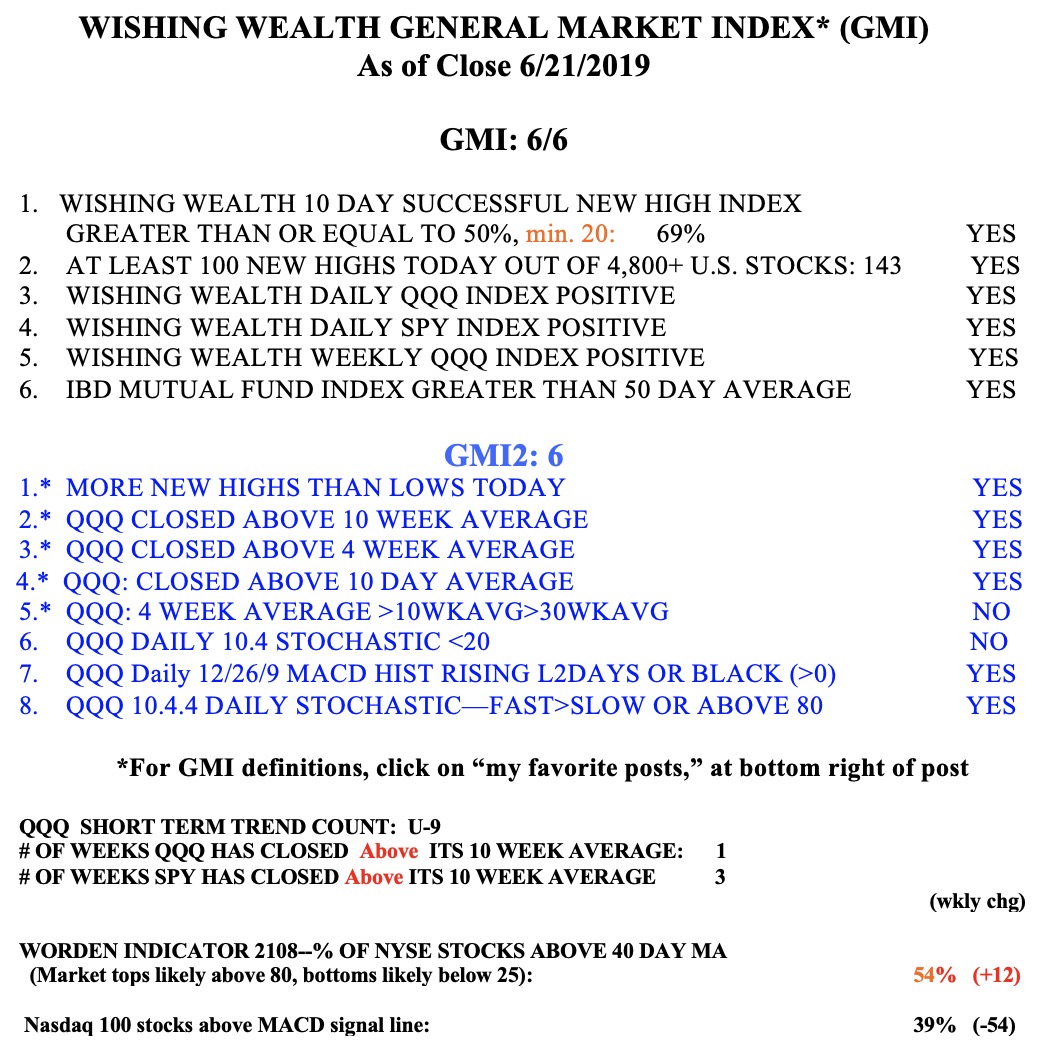
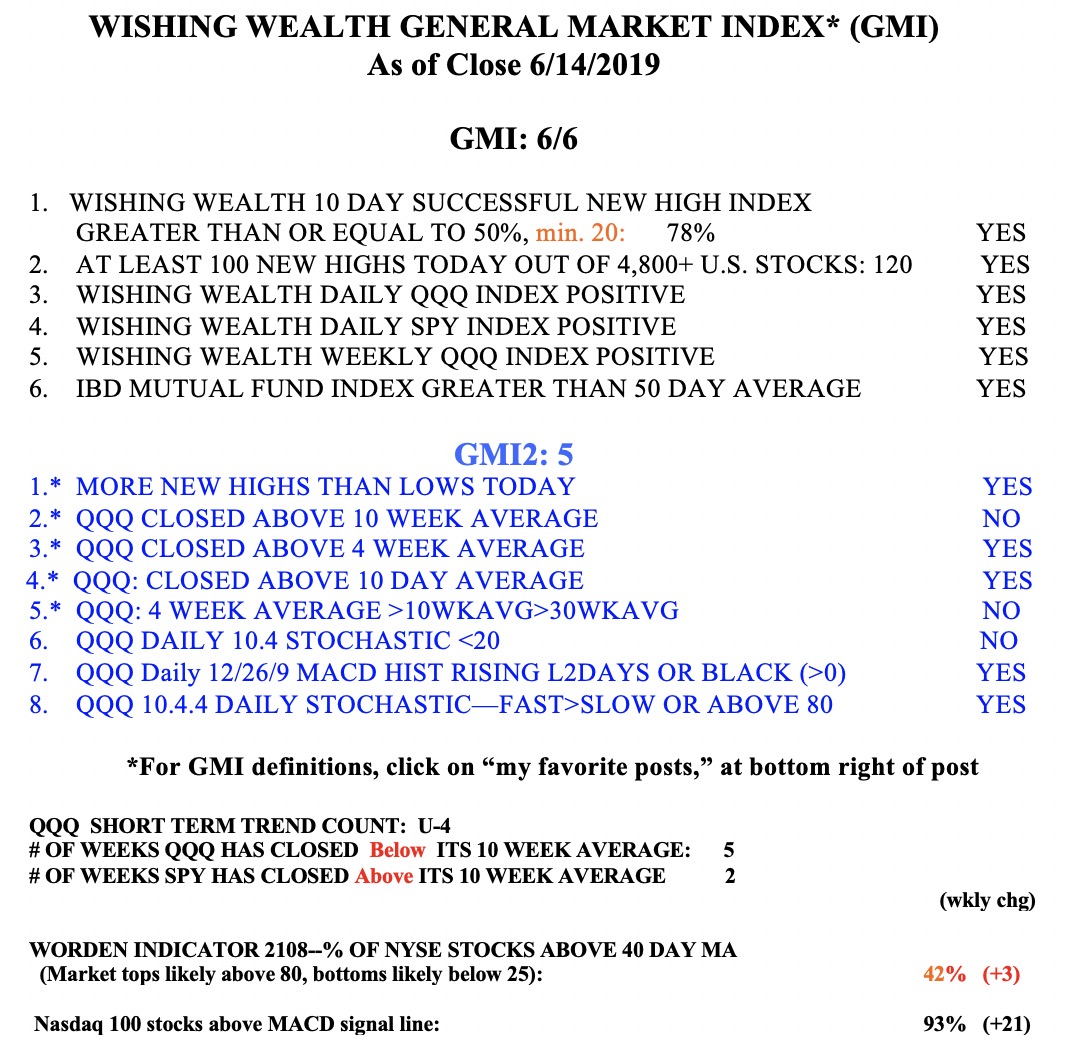
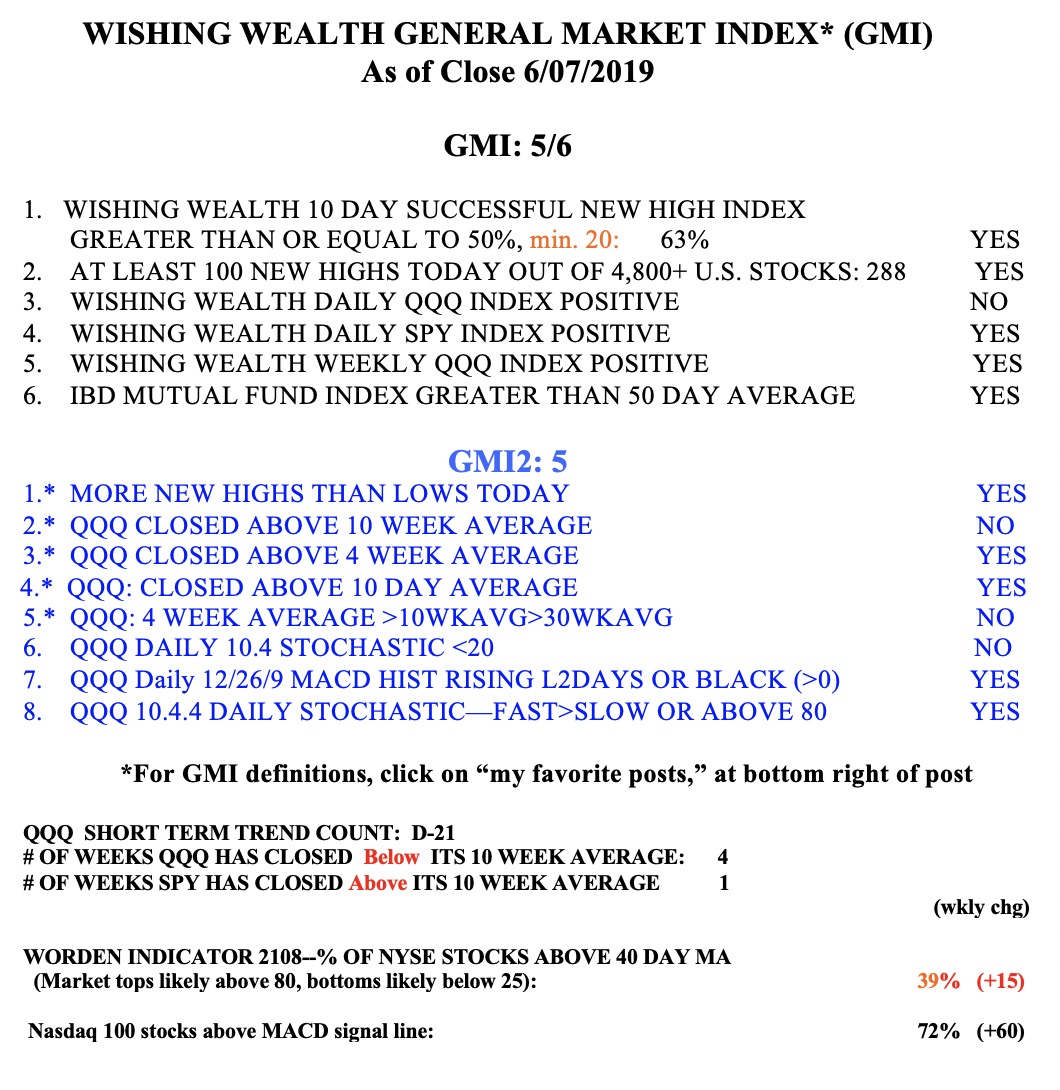
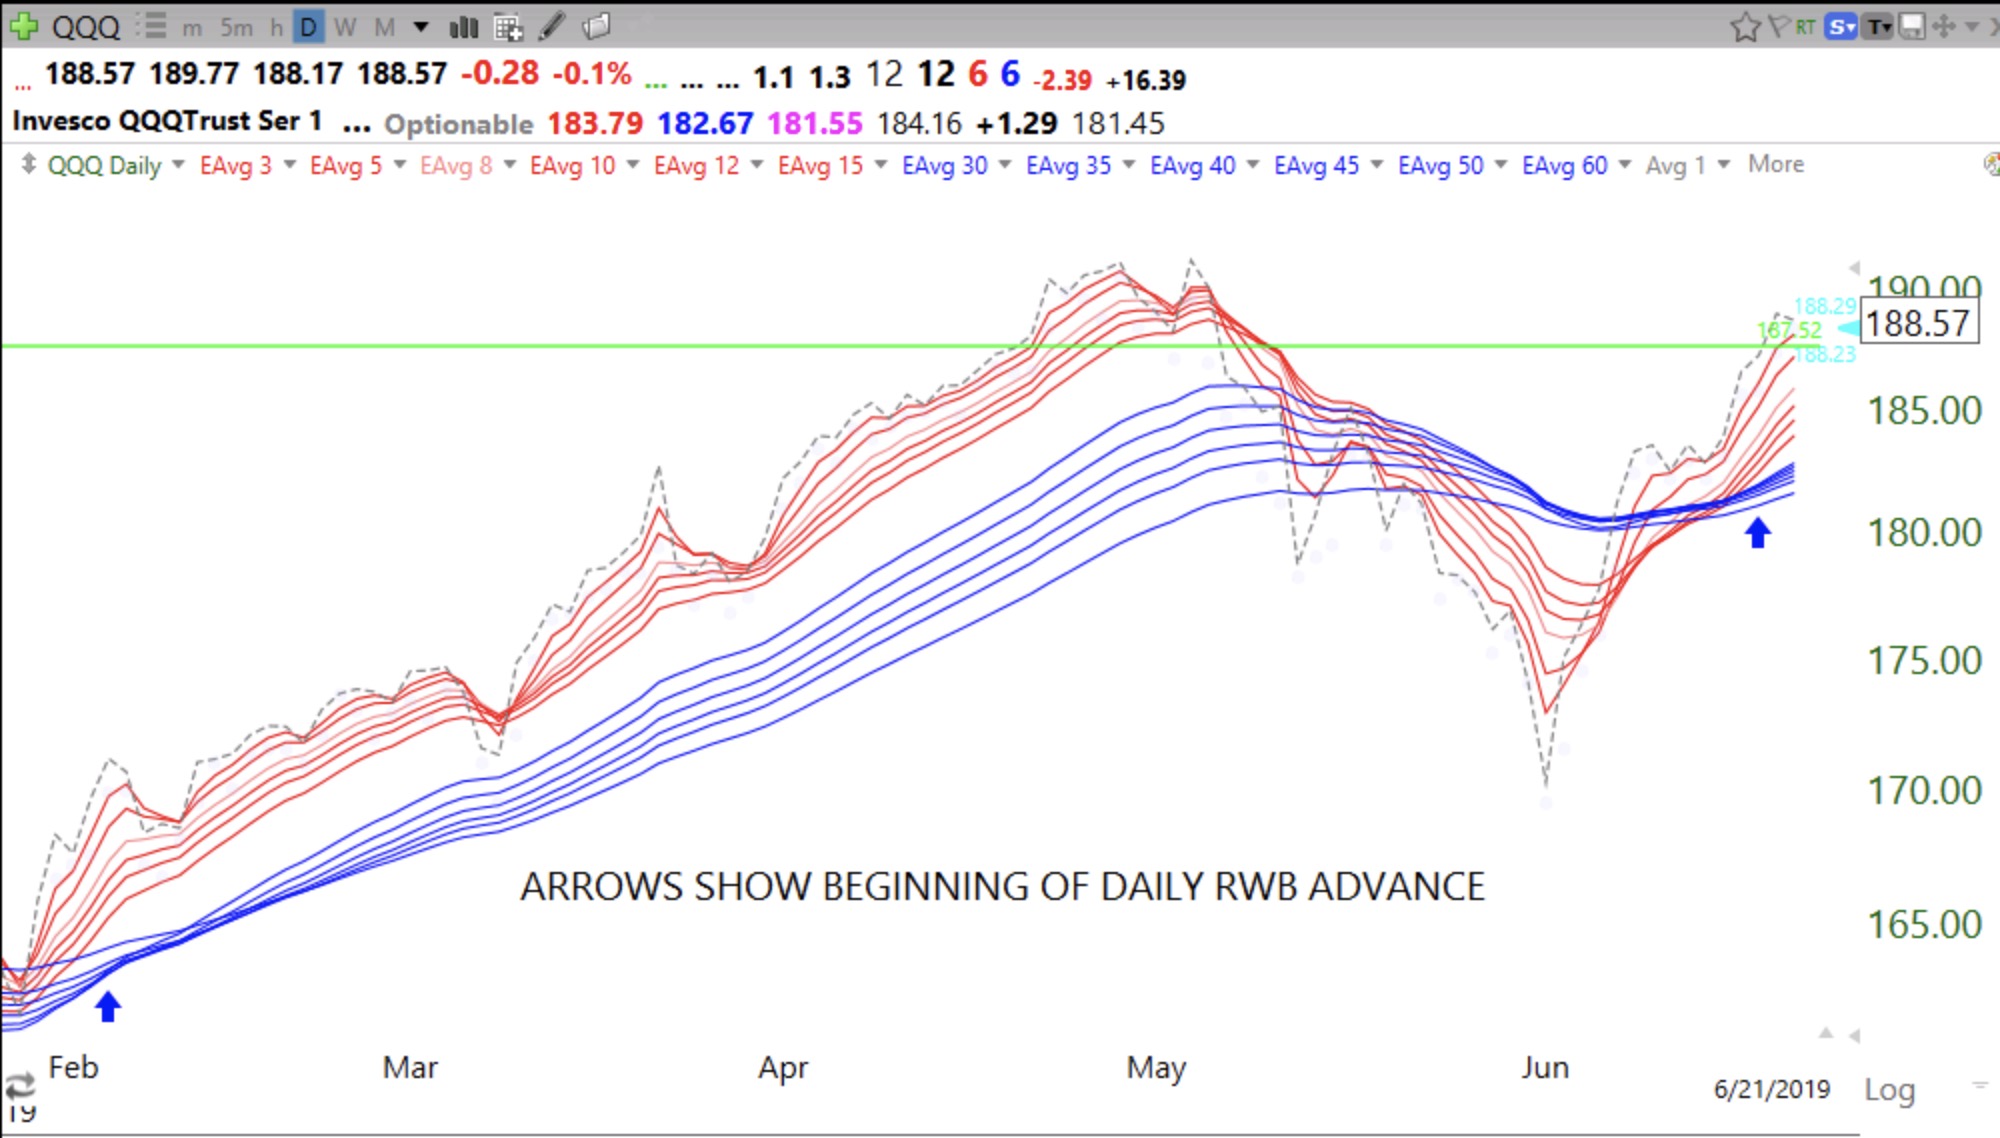
When I look at my market indicators and the charts of the major indexes, I see a rising up-trend. But when I listen to CNBC commentators I hear all the reasons not to trust this market. Jim Cramer even opines the market has it wrong. But I have heard that opinions are wrong, the market never is. I suspect Cramer has got it wrong, once again. How can I not trust a market where the GMI is Green, with 6  positive components (of 6)? Or where we see a beginning daily RWB up-trend?

In the past, after a significant decline, I waited to go long until after the 30 week average turned up again. Look at this weekly chart of the QQQ. Note that the 30 week average (red solid line) is turning up, as is the 4 week average (red dotted line). Weinstein Stage II?


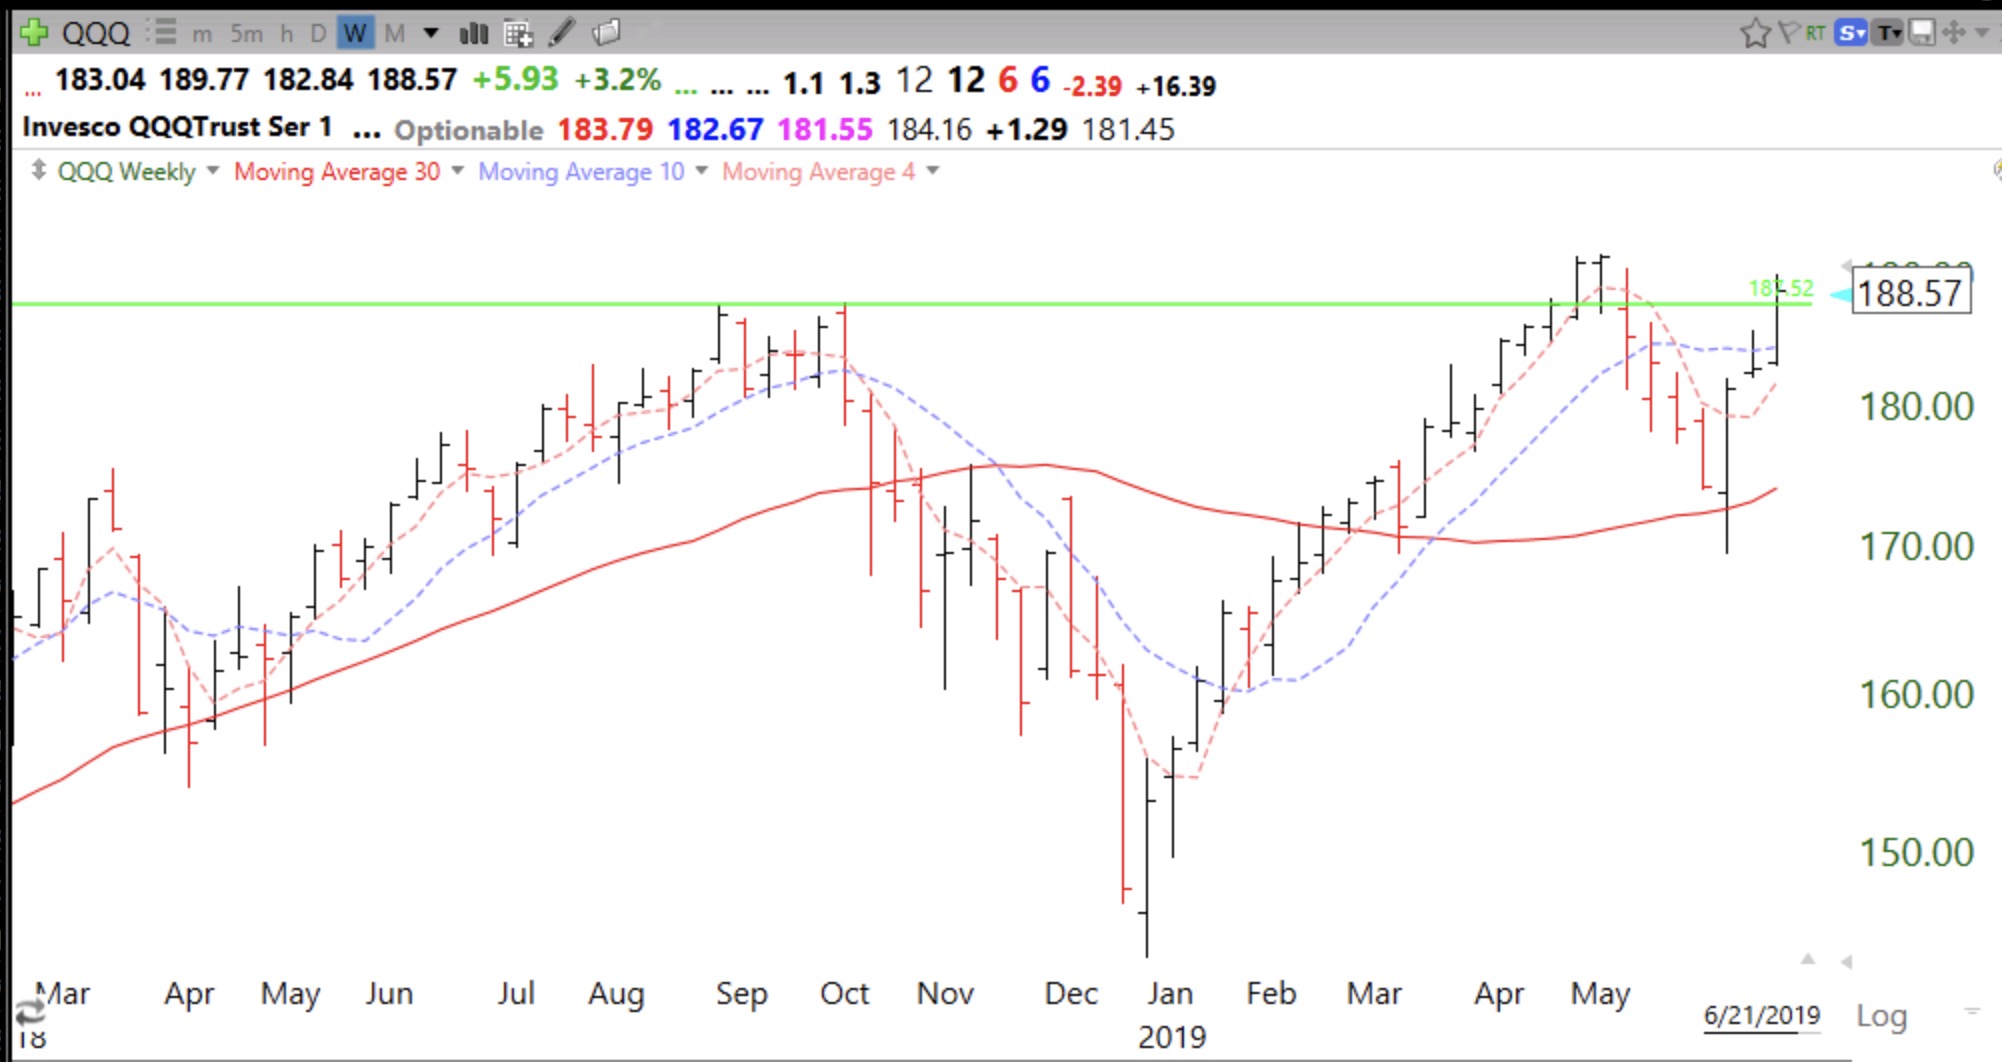
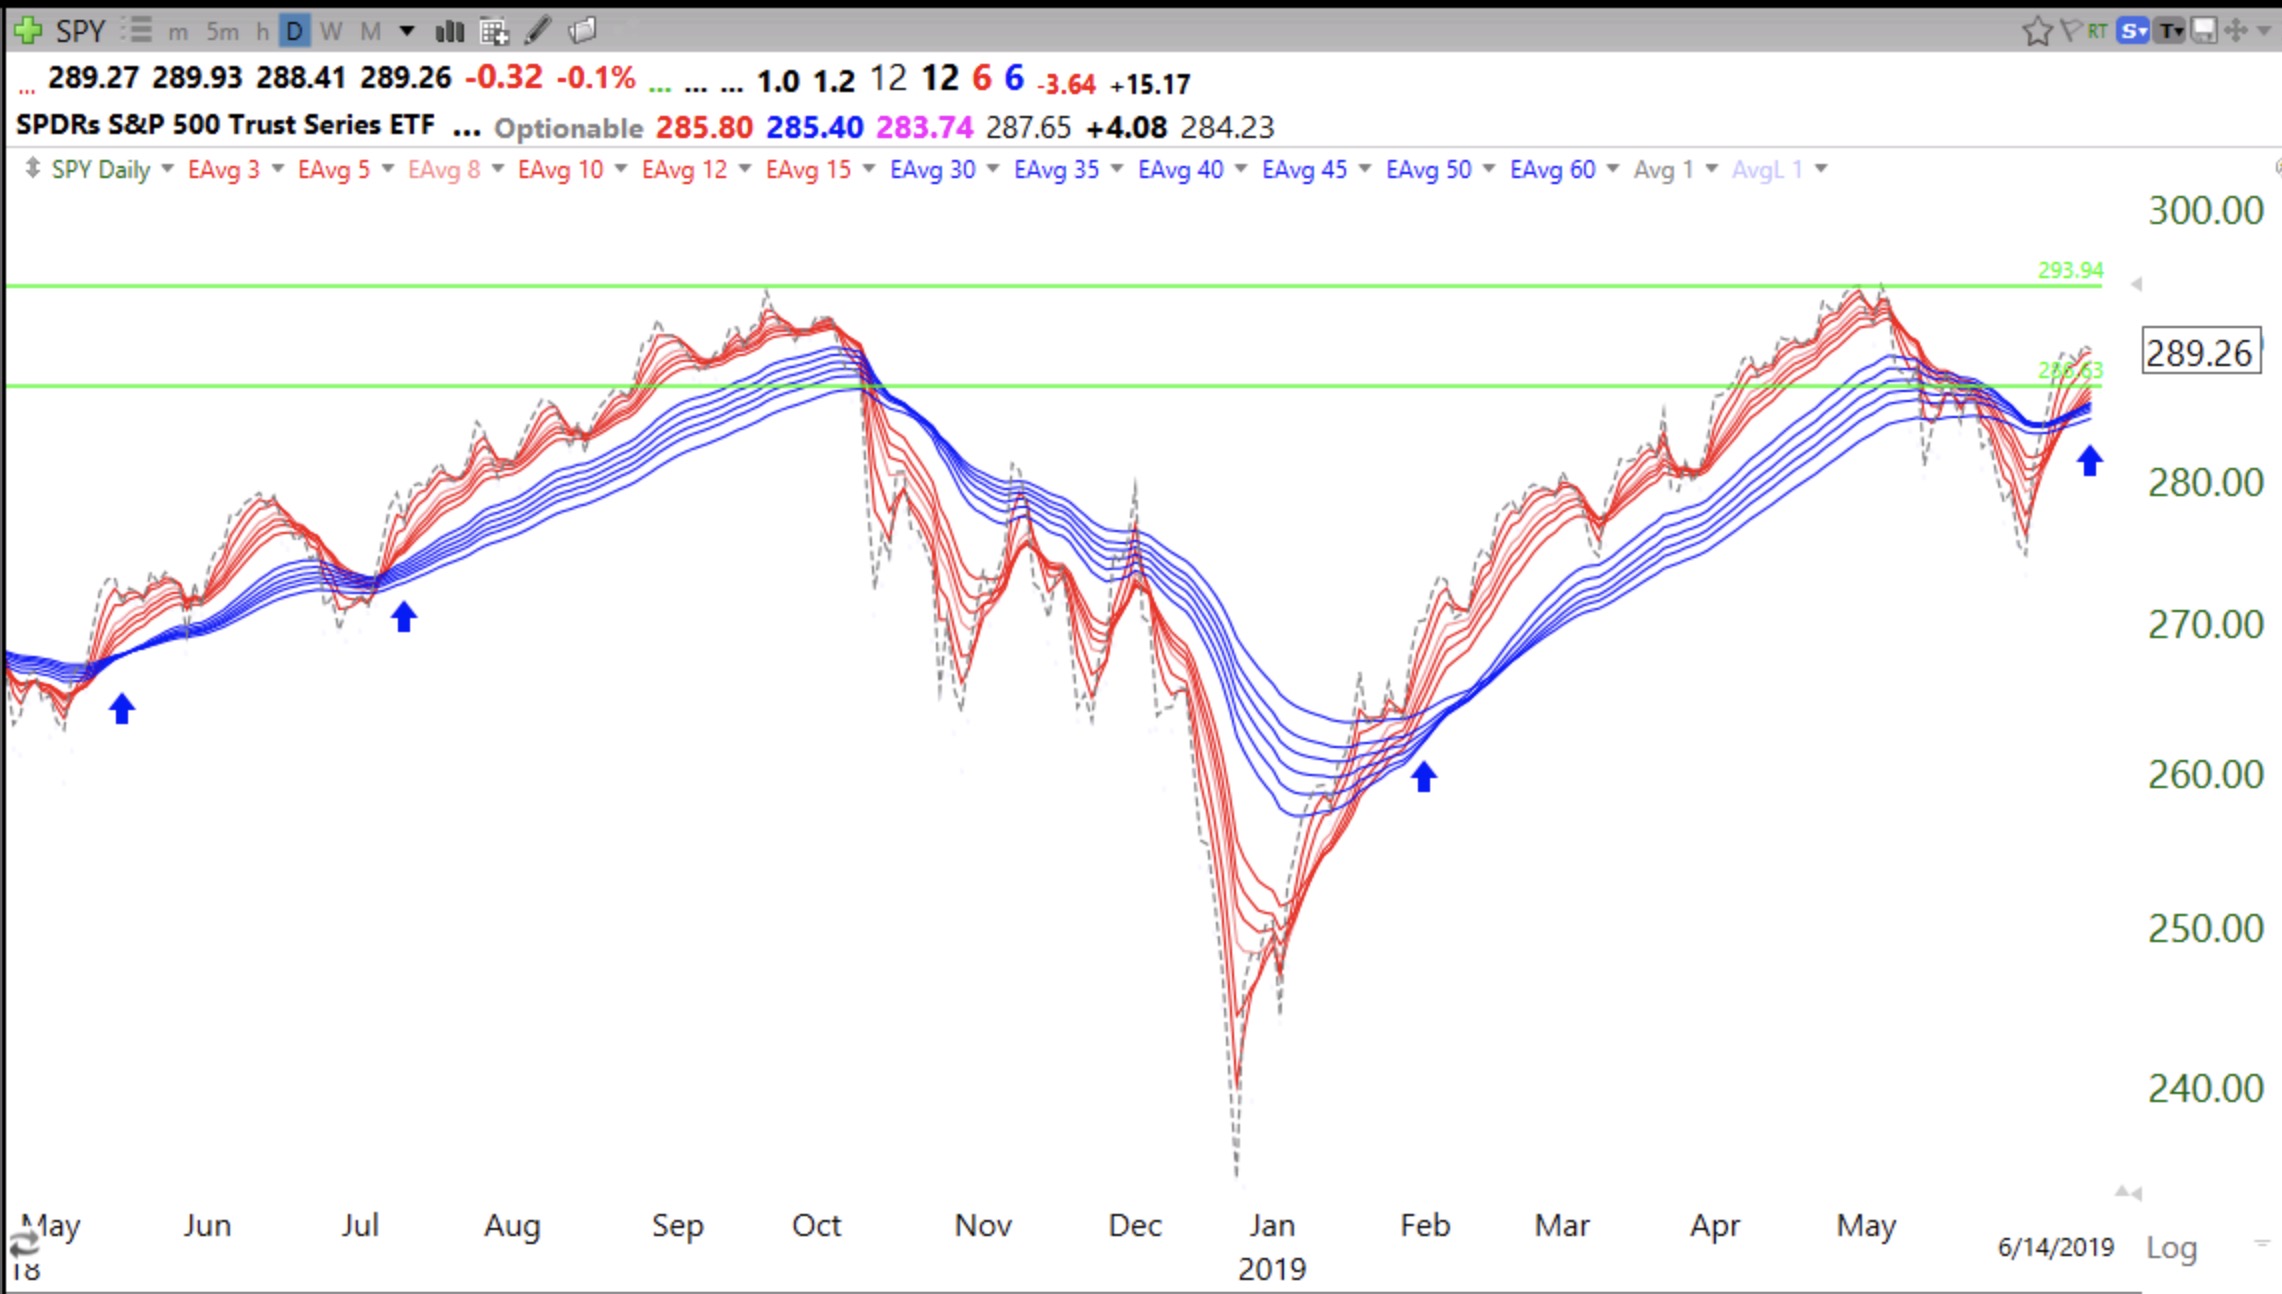
DIA and SPY tell the same story. Until these patterns fail, I am long this market.

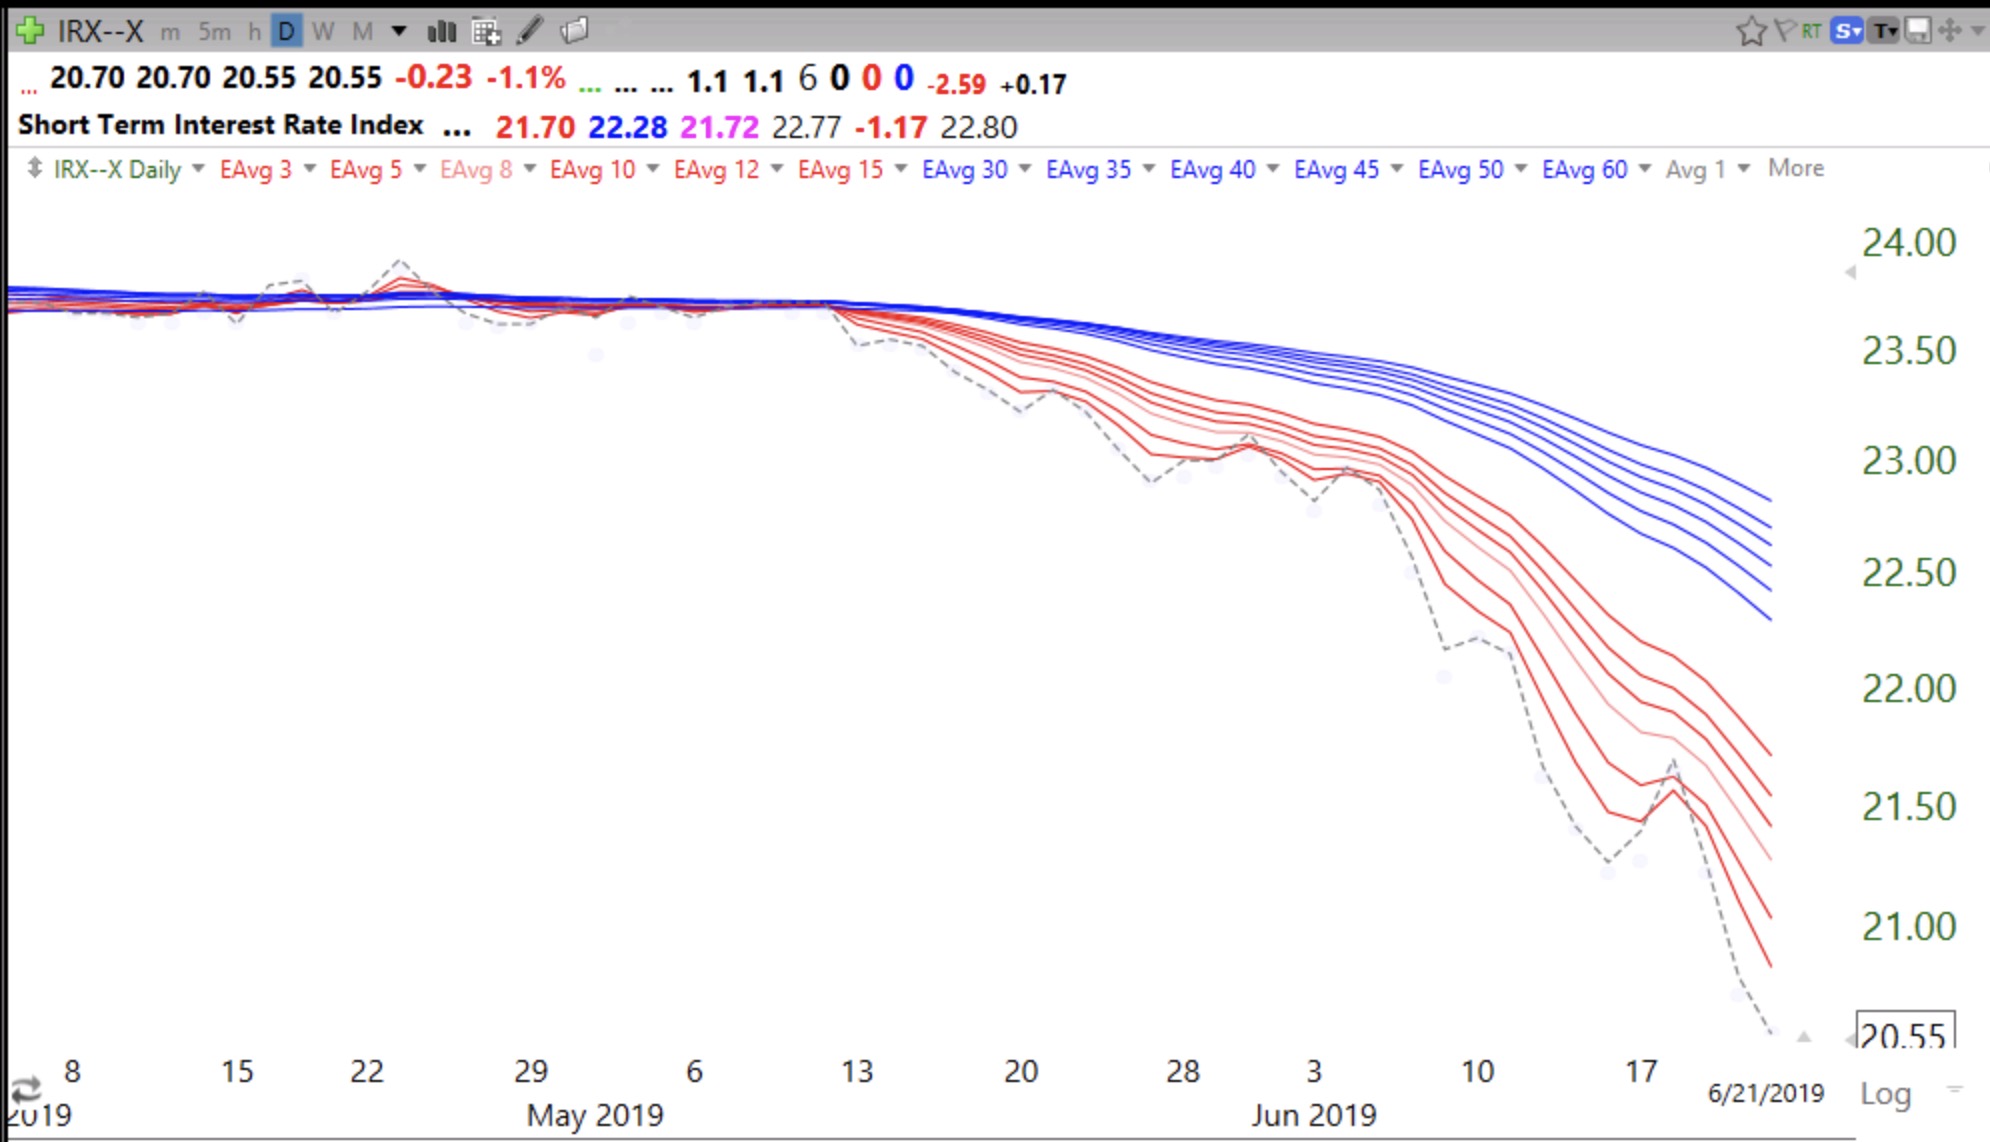
I suspect falling interest rates are behind the market’s strength. Money managers have no where to go but the equity market to grow their  money.


$SPY on verge of daily RWB up-trend–window dressing is upon us

GMI6/6
GMI-25/9
T210842%

I am watching for the beginning of a new significant up-trend in the major index ETFs. I define an RWB up-trend using 12 exponential moving averages and the close. A daily RWB up-trend is when the 6 red shorter daily averages are rising above the 6 blue longer daily averages so that there is a white space separating them. The beginning of a daily RWB up-trend starts with the closing price (dotted line) rising above all 12 averages. Next the red lines climb above the blue lines. The chart below has arrows showing the start of four RWB up-trends. It looks like the SPY is beginning an RWB up-trend but there is no visible white separation yet. If the RWB pattern matures, the market is headed higher. During most of an RWB rise, the closing price leads all of the averages higher. A failure of the RWB pattern would occur if the SPY were to close back below all 12 averages and the white separation disappears. We are approaching the end of second quarter and the likely mutual fund window dressing period, so it would not surprise me to see an up-trend develop. The DIA’s pattern looks like the SPY’s but the QQQ is a little further behind. These patterns help me with individual stocks too. It is important to study the market’s behavior, ignore the news and media pundits, and to pull the trigger only after a signal has occurred, not before.


The GMI=6 and Green.