I began this blog in 2006 after watching the media pundits and financial advisors lead the trusting public into the 2000 abyss after the internet bubble burst, while I was safely in cash. The same thing happened in 2008 and then again now. I do not advise people but merely report my actions. This site is free and I tell all that my musings are worth exactly what they paid for them. Nevertheless, I hope some of my readers have benefitted from my writings about exiting the market in February.
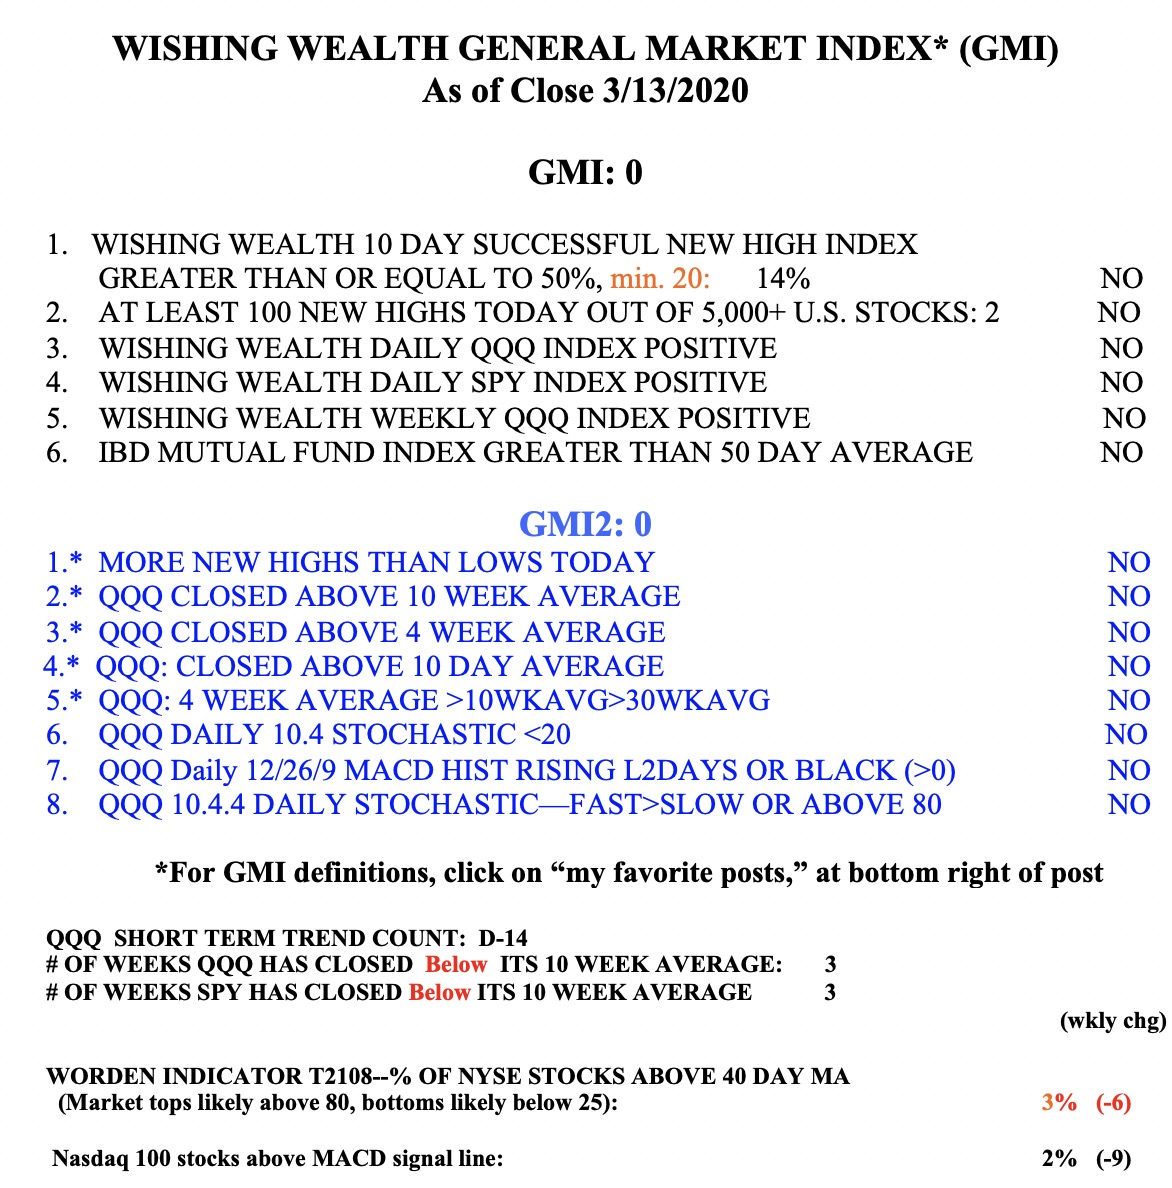
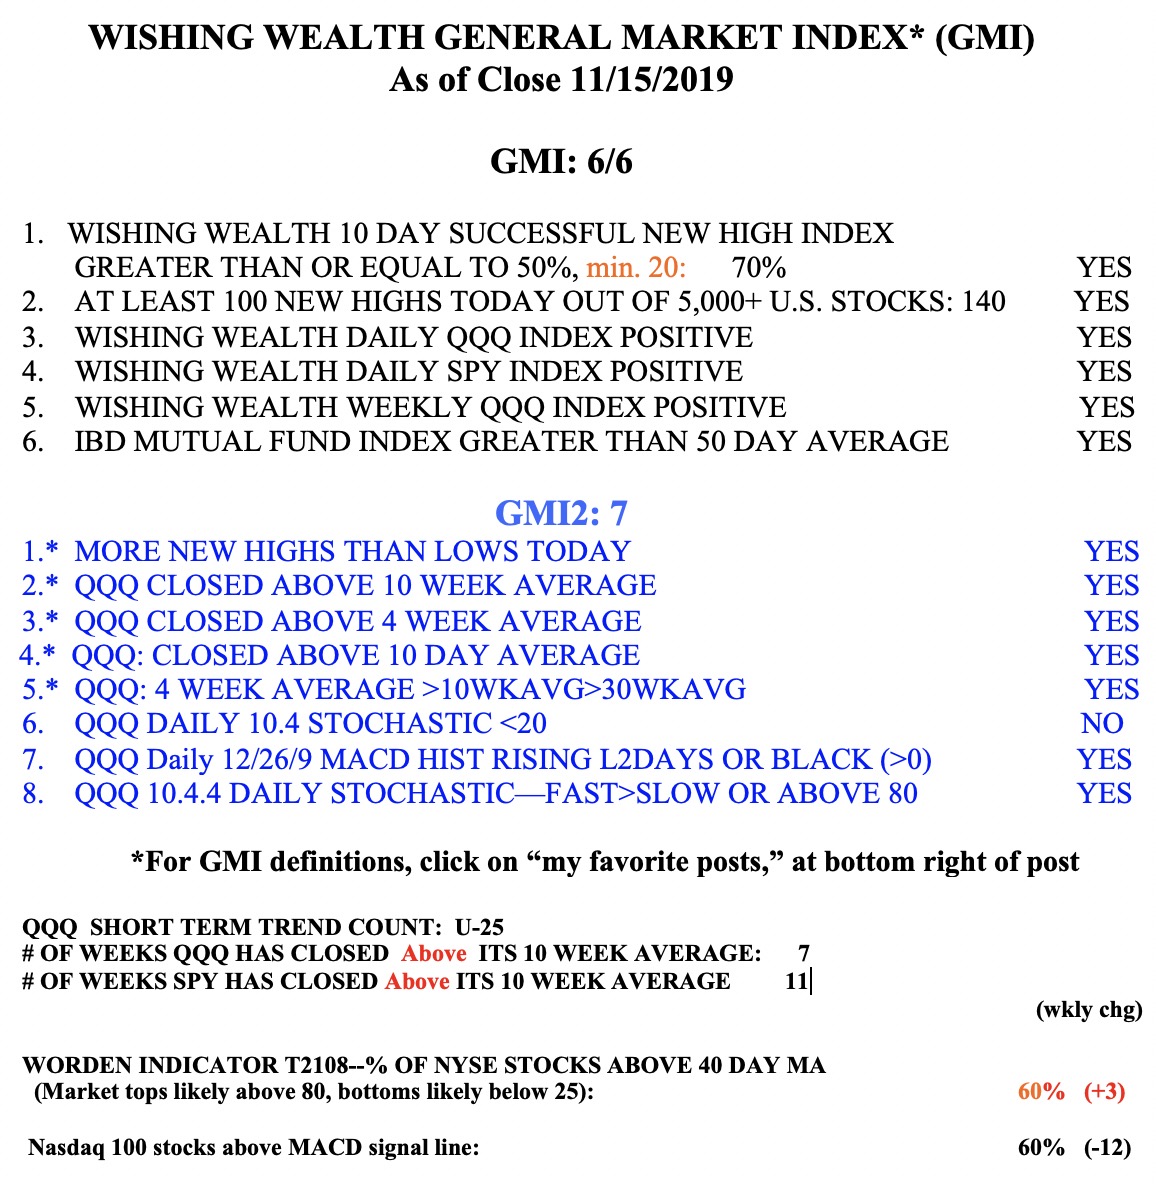
If it is impossible to time the market, then why have I been out of the market in bad times and back in during the good times? Just luck? As someone once replied, the harder I work, the luckier I get. The key for me is to ignore all of the talk about the market and to just watch what it is doing. I have simple criteria that have been summarized in the GMI table below, that keep me on the right side of the market’s trend. This is the strategy I teach my undergraduate students. With the GMI=0 (see Table below) why would I be invested long?
All persons with tax deferred IRAs and 401 (K) accounts can exit the market anytime, transfer into money market funds, and go back into mutual funds or equities later, without tax consequences. I know some employer plans limit market timing, but they usually let one exit and enter as long as it does not occur too often I(check your plan’s rules). So when things begin to look bad, I begin taking money off the table. I have been in 100% cash for weeks. After the GMI flashed a Red signal on February 26, why would I ever be invested long?
The other nonsense the pundits promote is, no one rings the bell at the bottom. Don’t get out because you will mss the bottom. I do not care if I miss the bottom or the top. There is plenty of room to make money in between. I do not care if the market rises 5-10% now without me. I am trying to avoid much larger losses. I will get back in after my indicators suggest that a new up-trend has begun and I will do so gradually, in stages, at ever higher prices. I will post here when I begin to re-enter.
This decline and the resulting low interest rates on savings vehicles will decimate my fellow boomers’ wealth. I hope those who did not escape this storm have the years necessary to recoup their money and a comfortable retirement. When will this decline end? No one knows.
Jesse Liver more once said:
The technology changes but trading is human behavior and human psychology never changes–greed and fear, euphoria and panic. People must learn a set of rules that help them to take small losses so as to avoid the large ones.
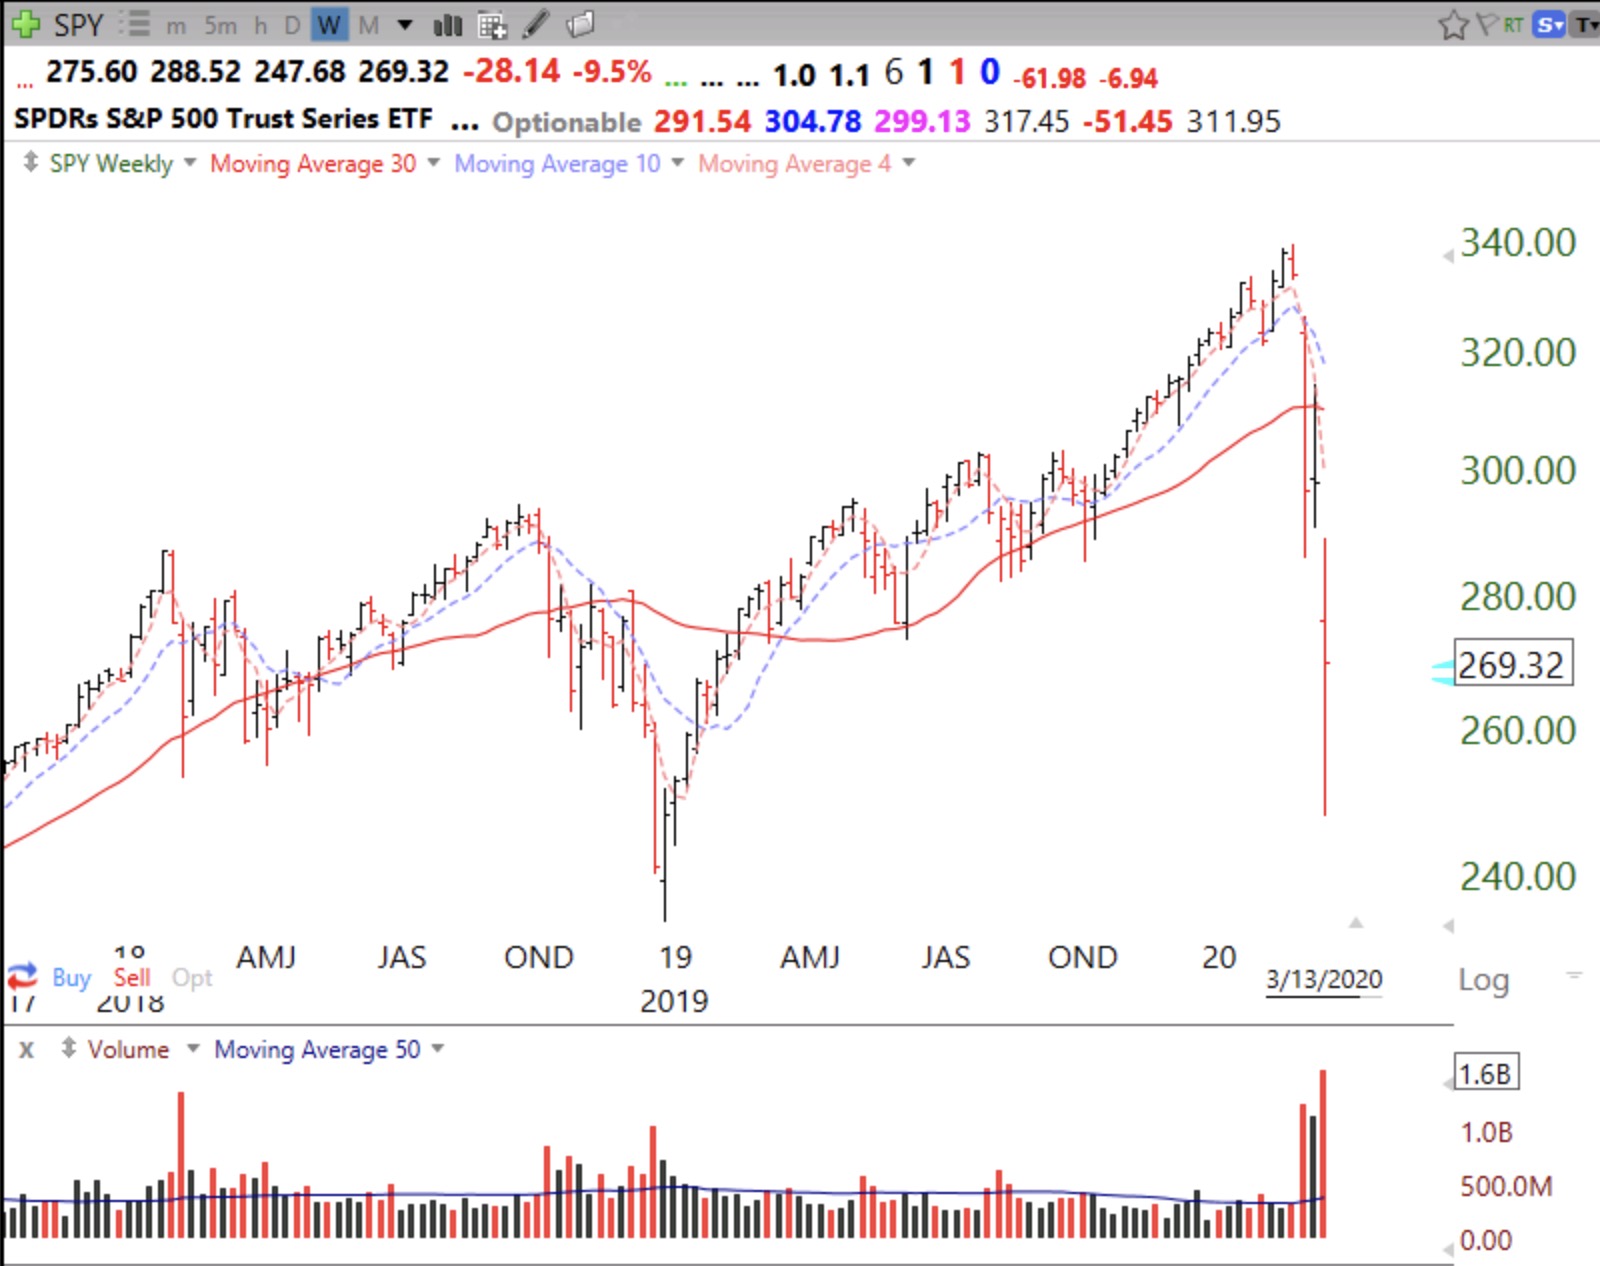
While I do not predict bottoms, this weekly chart of the SPY suggests to me the beginning, not the end of a Weinstein Stage IV decline. Note the huge weekly selling volume in two of the last three weeks. The SPY has only closed below its critical 30 week average (solid red line) for three weeks. Bear markets often last 10 months or more and we should not be misled by the speed of this decline. We could see much more… (then again, T2108=3%)
The GMI=0 and on a Red signal.