I wrote a post last week about the benefits of focusing on weekly charts. Weekly charts, unlike daily charts, more clearly show me the trend and are less likely to make me exit a strong stock too soon. I spent some time this weekend trying to write a scan for TC2000 that would bring up growth stocks emerging from a multi-week consolidation. The scan required a minimum amount of weekly volume and the stock must have shown above average weekly trading volume on the week of the break-out. The company must also have shown an increase in the latest quarterly earnings of at least +50%. Four stocks out of approximately 4900 US stocks were selected by this scan. Given the strong market environment, many stocks have already broken out. After running a scan like this I can then research the stocks for possible entry, looking at both technicals and fundamentals.
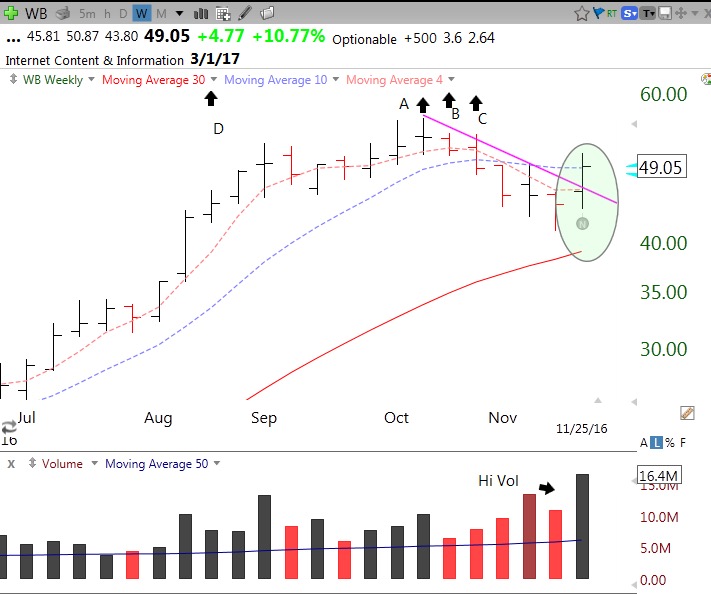
This weekly chart of one of the four stocks, WB, is fully annotated so you can see how I have set up my charts to quickly show other critical information contained in the TC2000 database. Arrow A shows that WB had latest quarterly earnings up 500%. Arrow B shows the latest short interest ratio was 3.6 (This means that it would take about 3.6 days to cover all of the shares speculators have sold short, at the stock’s recent average daily trading volume. The higher the number, the greater the buying pressure from a break-out.) Arrow C shows that the stock price is currently 2.64 times its price 250 days ago. (I like to buy stocks that have already doubled in the past year. Stocks, like people, tend to repeat their past behavior.) Arrow D shows WB’s projected next earnings reporting date, a new feature in Version 16 of TC2000. The green oval shows last week’s break-out above a declining trend (purple line) on above average weekly volume. In fact, this was the highest weekly volume for WB since September 2014! It could signify the resumption of the up-trend or it could mean nothing….
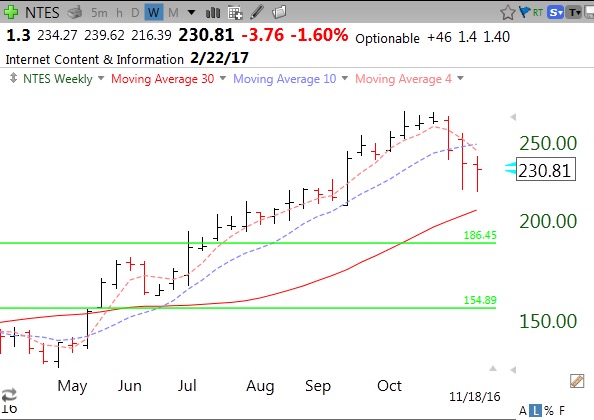
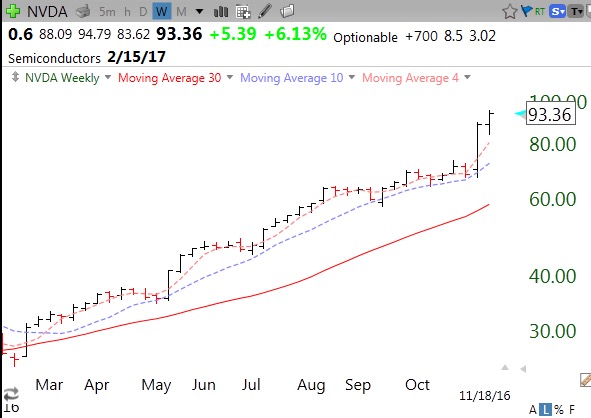
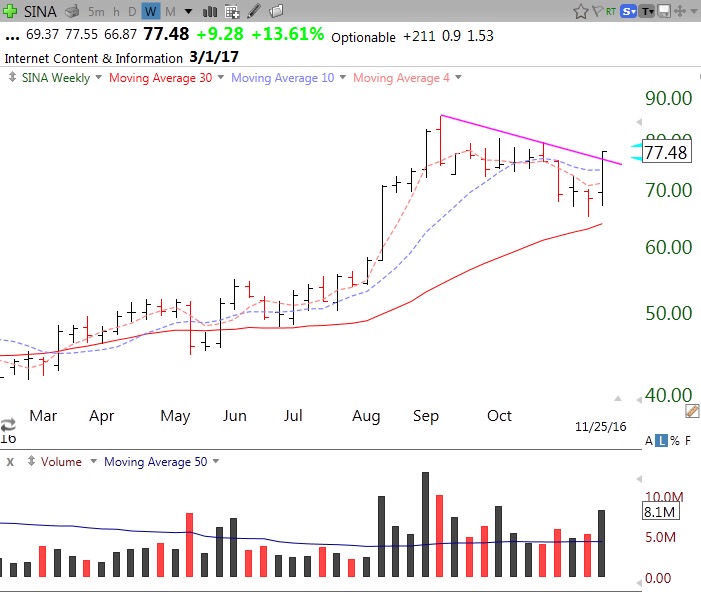
Another stock that came out of this scan was SINA. I did not annotate the remaining stocks. If you have read this far I know you can interpret the remaining weekly charts using the above example.
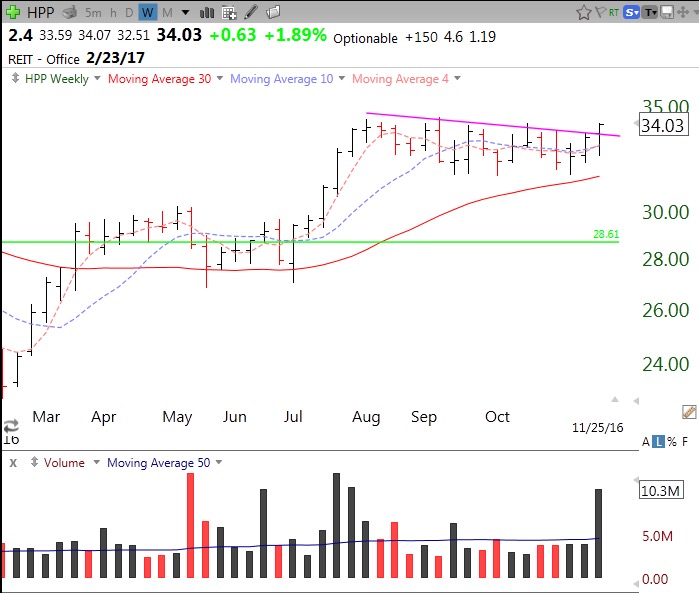
And HPP.
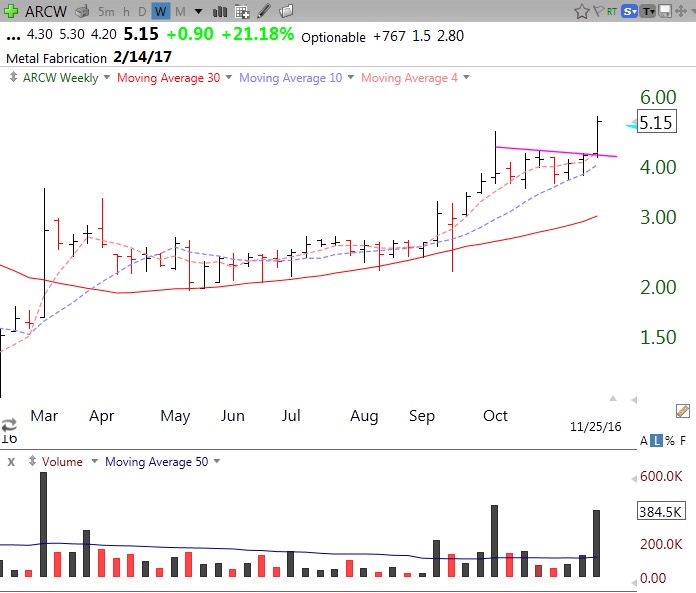
And ARCW.
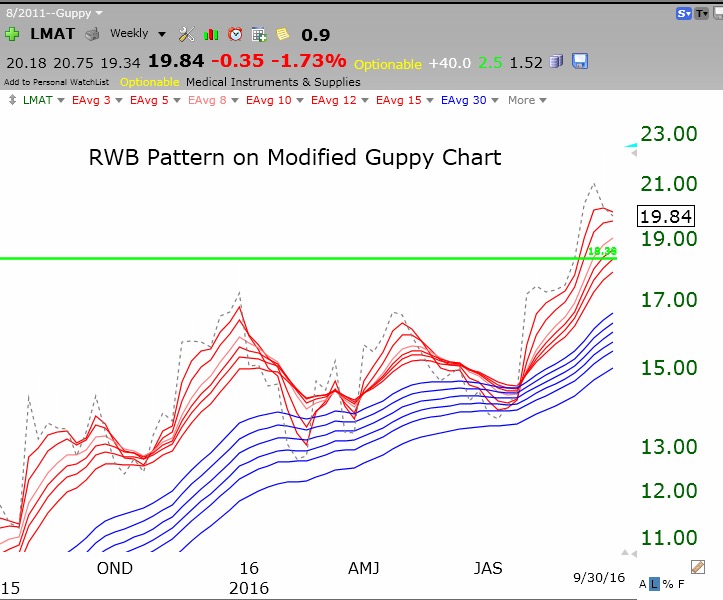
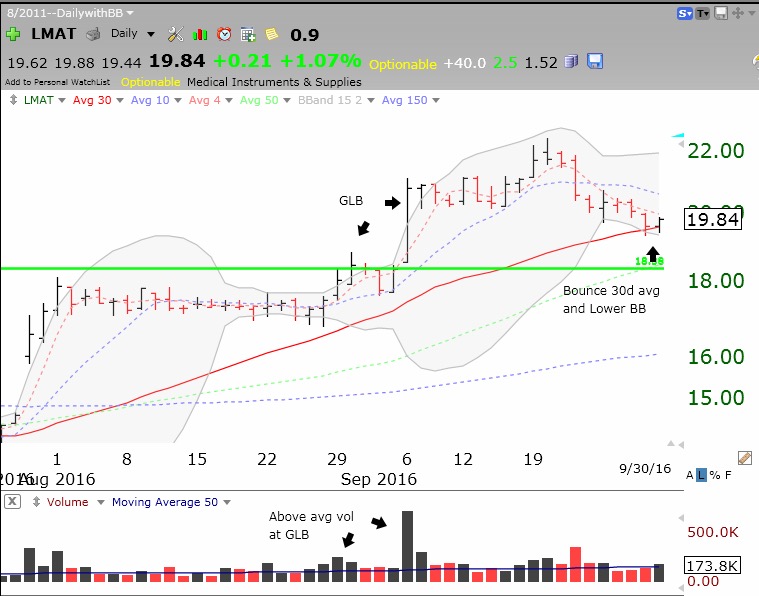
I do not know if any of these stocks will keep rising. But the market has been strong and many stocks have already broken out to new highs. Only WB and HPP are flirting with their all-time highs, a valuable characteristic. Both are above recent Green Line Break-outs (GLB). I like to buy stocks that have advanced a lot, then rested for a few weeks, and then break out of their consolidation on unusually high volume.
If you have TC2000, I have started making some of my scans and watchlists available to my students in a TC2000 library (Club, Dr. Wish). If you want access to my library, provide your name and email below and receive the free link in your email.
If you do not already subscribe to TC2000, you can get a $25 discount (new subscribers only) by clicking here or going to: http://www.tc2000.com/bonus/WWB (Additionally, your sign-up will generate a small commission for us to keep the lights on, so, thank you.)
You might also attend one of the many Worden TC2000 free training workshops when they come to a city near you. Ask them for a schedule at support@worden.com. That is how I began learning how to use TC2000 the past 20+ years. They also now post many video TC2000 tutorials on their site. If you follow me on Twitter I often tweet out interesting stocks intraday: @wishingwealth (no guarantees, of course, stocks I tweet about are for readers’ own education, further research and consideration).
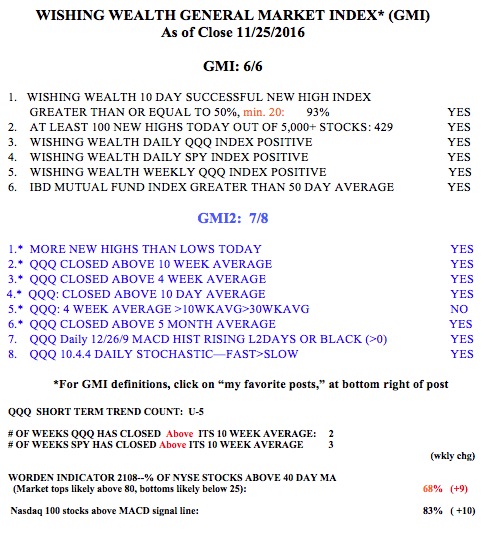
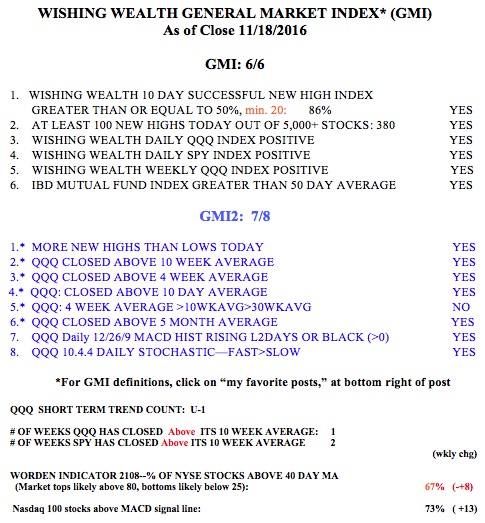
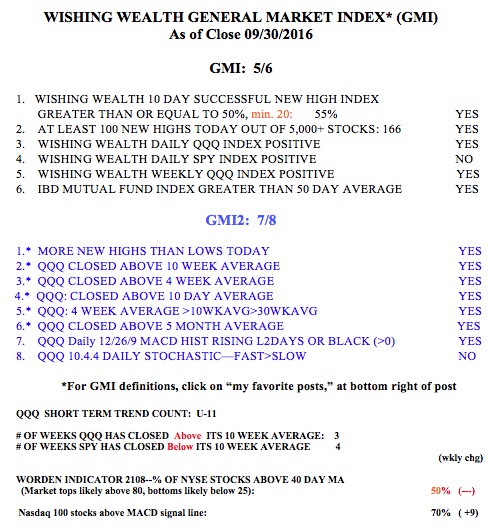
Meanwhile the market remains strong with the GMI at 6 (of 6) and the GMI-2 at 7 (of 8). And the new QQQ short term up-trend has now reached its critical 5th day. According to my analysis of QQQ short term trends over the past 10 years, once a new up-trend lasts 5 days, it has a 75% chance of reaching 11-88 days. Take a look at the GLB tracker to the right of this page to see how well GLB stocks have been doing in this strong market up-trend. Nothing like a strong market to make everyone look like a genius!