NOTE: A NEW SECTION TO THE BOTTOM RIGHT PROVIDES LINKS TO MY FAVORITE PRIOR POSTS. THESE INCLUDE MY STRATEGY POSTS, DEFINITIONS OF THE GMI COMPONENTS, AND MY ANALYSIS OF WHY THE TRADING TECHNIQUES OF THE GREAT NICOLAS DARVAS WORK BEST DURING BULL MARKETS AT ALL-TIME HIGHS.
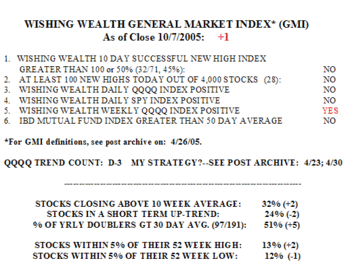
What a week! The GMI remains firmly at a maximum +6. 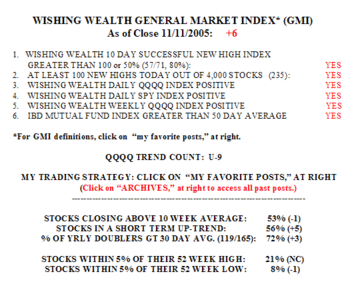 I will show you below how the GMI has kept me out of the market (or short) during declines and back in during rallies. 80% (57/71) of the stocks that hit new highs 10 days ago closed higher Friday than they closed 10 days earlier. In contrast, only 24% of the stocks that hit new lows 10 days ago closed lower than they did 10 days earlier. The moral? In a strong market buying new highs is much more likely to prove profitable than shorting new lows. There were 234 new highs on Friday and only 44 new lows in my universe of 4,000 stocks. 56% of stocks are in a short term up-trend and 53% closed above their 10 week averages. Almost three quarters (72%) of the 165 stocks that have doubled in the past year closed above their 30 day averages, along with 80% of all of the Nasdaq 100 stocks. Friday was the ninth day (U-9) in the QQQQ (Nasdaq 100 ETF) up-trend.
Here is a chart of the changes in the GMI since its inception. Click on this to enlarge. Note the periods 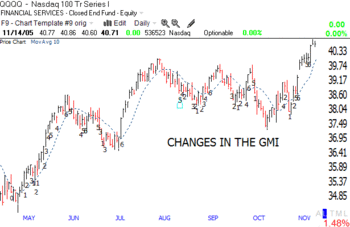 when the GMI is greater then 5 that it has been a good time to be long. The GMI was +6 for all of July and 5 or greater since November 1. I leave you to judge whether it is a useful market timing indicator. It is for me.
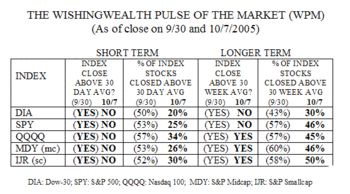
The WPM showed major strength in all five indexes. 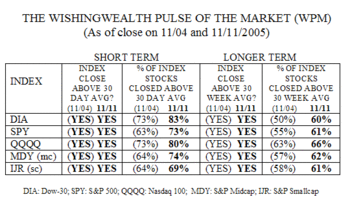 All of the indexes closed above their 30 day and 30 week averages. 83% of the Dow 30 stocks and 80% of the Nasdaq 100 stocks closed above their 30 day averages and the remaining three indexes were not far behind. 60% or more of the component stocks are now above their 30 week indexes. This is a market where all types of stocks are participating and where both the short term and longer trends are up. It is noteworthy that the Dow 30 stocks are now quite strong.
We never know how long a trend will last. But it is important to hitch a ride on a strong trend early and ride it until it flashes warning signals. The reasons behind this up-trend will eventually come out. But often times the good news comes out closer to the end of the up-trend than to the beginning. It is important not to fall into the trap of waiting for a rationale for an up-trend before getting in. When your train leaves the station, it does little good to stay on the platform and argue that the schedule is off or that it should not have departed.
Cramer had a nice interview on 60 Minutes tonight. It was a love feast–I thought they were supposed to be investigative reporters!!?? Anyway, I though I would quote you what JC has to say about charts in his new book. "Looking at the chart, the graphic demonstration of where a stock has gone, is not homework. It can tell you nothing. …………..In investing a picture is not worth a thousand words; in fact it is almost worth nothing. A chart is never enough to buy a stock. Never. Don’t be conned into believing that looking at a chart can suffice for homework; it simply can’t." (Cramer, 2005, pp86-87.)
I agree with Cramer that trading decisions should not be made solely according to a chart. (Why not buy stocks that look technically strong AND that have good fundamentals?) A few pages later Cramer writes: "Because stocks anticipate the fortunes of their companies, the collapse of Maytag the stock occurs ahead of Maytag the company." (p. 110). Cramer proves the value of charts. If a stock tanks before the bad business news underlying the decline comes out, the only way we outsiders can discern the weakness early enough to get out is by studying the stock’s price and volume trends via its chart. Studying the Nasdaq’s chart got me out of the market in 2000, and had me buying put options (selling short) on Enron long before the bad company news came out. I rest my case.
Here are a few stocks with good fundamentals and charts. Among the stocks that hit new highs on Friday, who are up at least 60% this year and who have recent quarterly earnings increases of 100% or more are: TIE, LMIA, NWRE, TRAD, IRIS, HANS, ISRG, HUBG, MRVL, VTAL, HOLX, GHL, JLG, SUPX. I own some of these and think they are good stocks to research. I make a small pilot buy and slowly average up in the ones that work out. I also always place a stop loss for insurance, to limit my losses. Have a great week.
Please send me your feedback at: silentknight@wishingwealthblog.com.
