Well, I missed a post and the Wish contrary indicator still works. If I am so tired/frustrated that I do not post, it usually marks a short term bottom. Fortunately, I still had some long holdings along with my puts on housing stocks, which recovered on Wednesday. So, did any of my indicators give us a hint of a bottom? On Monday I wrote that only 30% of stocks were in a short term up trend, the least since March 10 (27%). What I did not notice was that March 10 was the bottom of the decline in the QQQQ (@ 40.19) in March. So the next time we see this indicator around 30% we should be looking for a short term bounce OR a serious decline. History rarely repeats itself exactly in the market.
Tonight was IBD Meet-up night. For the first time, no one but I attended. In prior months, when people were so demoralized that few attended the monthly meeting, it represented a good time to buy. So tonight’s action may represent a screaming buy signal. Perhaps people have been so whipsawed by this market that the 200 point rise on Tuesday merely shoved car loads of salt into everyones’ psychic wounds.
My indicators have bounced back with the GMI now at the maximum reading of +6. 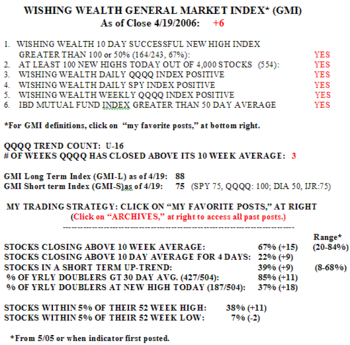 The GMI-L is now at 100 and the GMI-S at 88. 39% of stocks are now in a short term up trend. The QQQQ is the strongest index right now. The QQQQ is now in its 16th day of its short term up trend. There were 554 new highs in my universe of 4,000 stocks on Wednesday. An amazing 38% of stocks are now within 5% of their 52 week highs. 67% of stocks closed above their 10 week averages…..
I know it seems insane that the market would rise with $72 oil and rocketing gold prices. But we know that when the market wants to move one must jump on board or get out of the way. The failure of the housing stocks to hold their gains on Wednesday is an ominous sign and suggests that that sector just had a short covering rally on Tuesday, and not a real bottom. When the euphoria over current earnings dissipates, we might see these stocks and others come crashing down. Beware the Ides of May………..
Please send your comments to: silentknight@wishingwealthblog.com.
 Only 18% of the Nasdaq 100 stocks rose on Friday along with 42-43% of the S&P 500 and Dow 30 stocks. But there were still 407 yearly highs in my universe of 4,000 stocks. 63% of stocks closed above their 10 week averages. The GMI-L remains at 100, indicating that stocks remain in a longer term up trend. The QQQQ completed its fourth weekly close above its ten week average and Friday was the eighteenth day in the QQQQ short term up-trend (U-18). It seems to me this up trend in the major market indexes may last until earnings are out. And then that often under-performing May-October period begins for the market.
