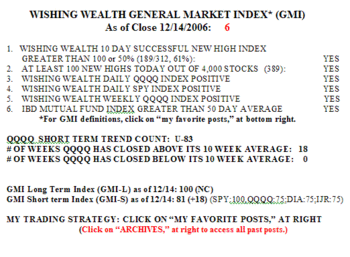
The GMI is still 6, but the GMI-S fell 18, to 63. The short term indicators for the small cap stocks (IJR) are almost all negative. Only the Dow 30 stocks are holding up (DIA). Only 24% of the Nasdaq 100 stocks advanced on Monday, 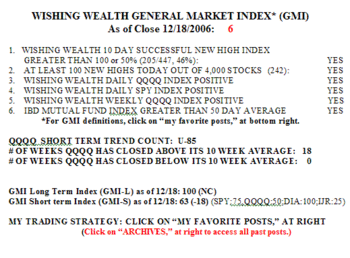 along with 31% of the S&P 500 stocks and 57% of the Dow 30 stocks. Even the stocks on the new IBD 100 list published on Monday were weak; 26% advanced, though 17 hit a new high during the day.
When I see the market leaders weaken, GOOG (-3.6%) and AAPL (-2.6%), I become concerned about the market trend. Yes, the GMI is at a maximum 6, but it would not take much more of a decline in the QQQQ to cause it to rapidly weaken. Let’s not try to anticipate the market, however. We can wait for a definite sell signal to take action. Just remember, this market has been in a strong up-trend for 85 days. The 10 day average has closed above its 30 day average every day since 8/16 when the rally began. During the huge rally in the QQQQ that began in March, 2003 after the 2002 bottom, the 10 day average closed above its 30 day average for 103 days. I have to suspect that we are not far from at least a temporary pause in this up-trend.
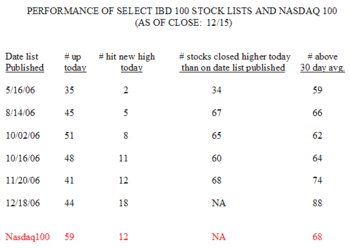 44% of the stocks on the list from 12/18 rose on Friday and 18 of them hit a new 52 week high. 88% of the stocks on the new list closed above their 30 day averages, substantially better than the other IBD 100 lists in the table. With the exception of the stocks on the list published on 5/16, the majority of the IBD 100 stocks closed higher than they did on the date their list was published. In contrast, more of the stocks in the Nasdaq 100 index (59) advanced on Friday.