16th day of $QQQ short term up-trend; $QQQ has WGB (weekly green bar) and a Yellow Band pattern and a daily RWB up-trend pattern.

GMI6/6
GMI-27/9
T210847%

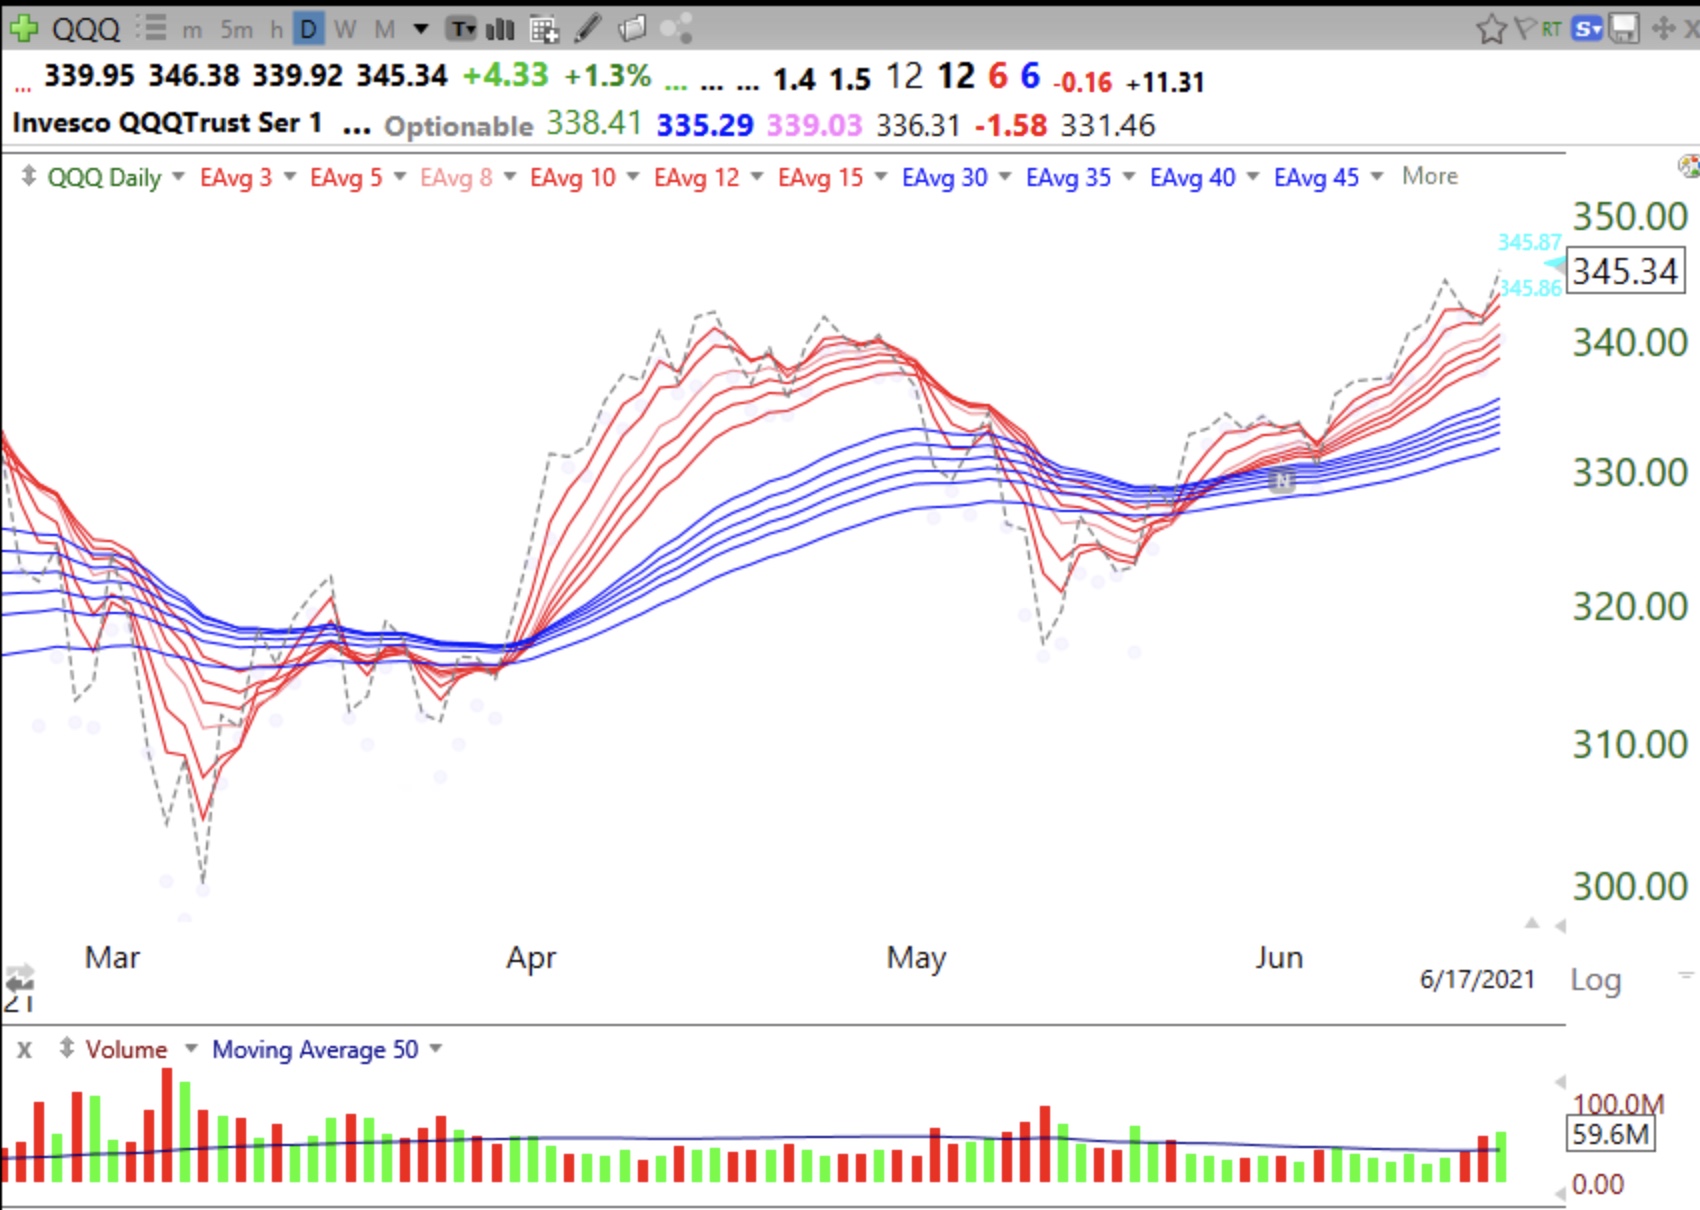
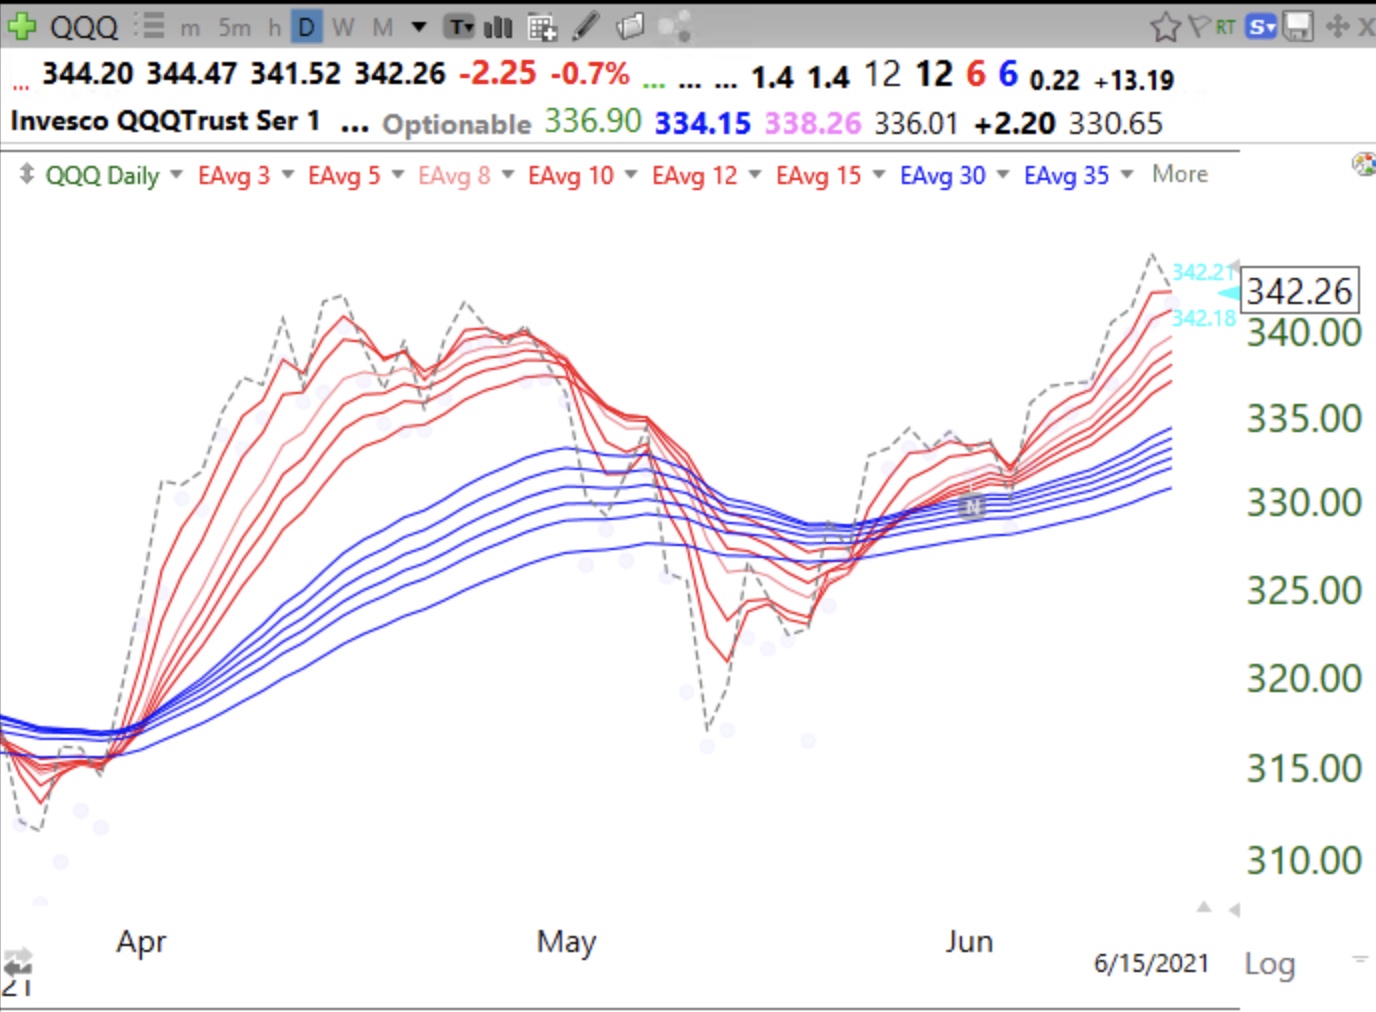
The QQQ is looking quite strong. Note that it has bounced up off of its 10 week (purple dotted line) and 4 week averages (WGB pattern) and has closed above its 10 week average (solid red line) for 10 straight weeks (Yellow Band pattern). I remain mostly invested in $TQQQ, the 3x leverage bullish ETF for QQQ. Viewers of my TraderLion presentation or last night’s talk at the Long Island Stock Traders Meetup will understand these terms. You may also go to the  Topics tab on this blog and find my 2012 Houston TC2000 users group webinar.  I showed in the past 2 events that in a sustained QQQ up-trend, TQQQ will outperform more than 90% of individual stocks. Since day one of the current QQQ short term up-trend on 5/26, QQQ has advanced +3.35% while TQQQ has advanced + 10.02%. Only 9 of the Nasdaq 100 stocks advanced more than TQQQ. Why not just buy TQQQ at the start of a QQQ up-trend instead of trying to identify the rare stock that will beat it? I accumulate TQQQ slowly as the up-trend continues and sell immediately when it falters.

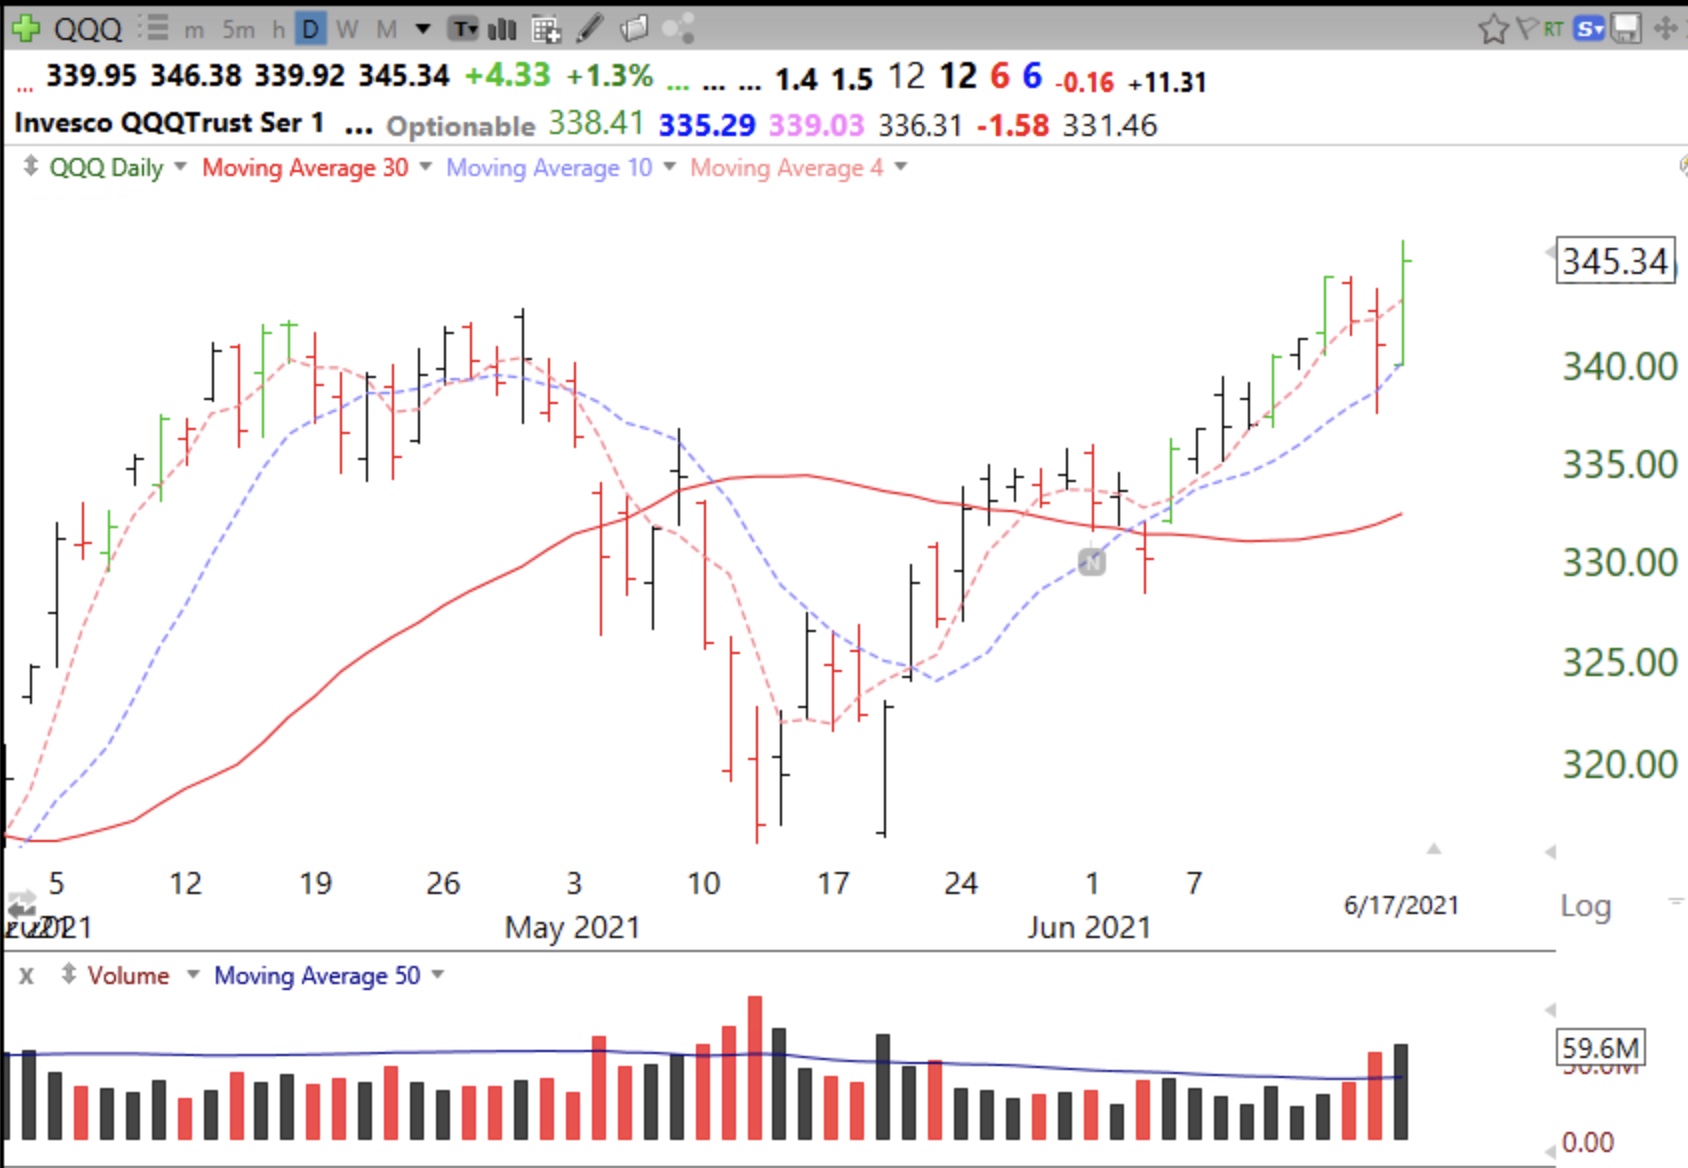
QQQ also has a daily  RWB up-trend pattern.


13th day of $QQQ short term up-trend; Join me at the free online Long Island Stock Traders meet-up this Wednesday evening; $UPST oversold

GMI6/6
GMI-27/9
T210859%

Thank you for the many nice comments about my last Saturday’s presentation at the TraderLion first annual conference. You may go to their site to view the recordings of all of the great speakers. This Wednesday at 7:30 PM I will present at the Long Island Stock Traders meetup. You may register for this free event. I will have 2 hours to talk and should have time to go deeper into my TC2000 set-ups and to answer questions.

A recent IPO I have been watching, $UPST, now has a very oversold 10.1 stochastic (6.52) and a low 10.4 stochastic (14.73). It is also on its lower daily 15.2 Bollinger Band.  I am waiting for a move up (black dot signal) or a cross of the fast stochastic (red) over the slow (blue) which is my green dot signal. If I should buy, I will place my stop below the low of the bounce, currently around 120. However, unless this market moves up quickly, UPST may need to consolidate more. Here are its daily and weekly charts. See you Wednesday….