I have many alerts set in TC2000 to tell me when a stock trades at a particular price or breaks out. I often tweet out the alert intraday. You may follow my tweets @wishingwealth but understand that these tweets are not recommendations and could reflect varying technical signs. One should review the stock and its pattern to determine if it makes sense to you and meets your level of risk. I do not tweet when a break out fails but expect that all buyers would have put in a physical or mental stop loss GTC immediately after buying to protect themselves and control risk.
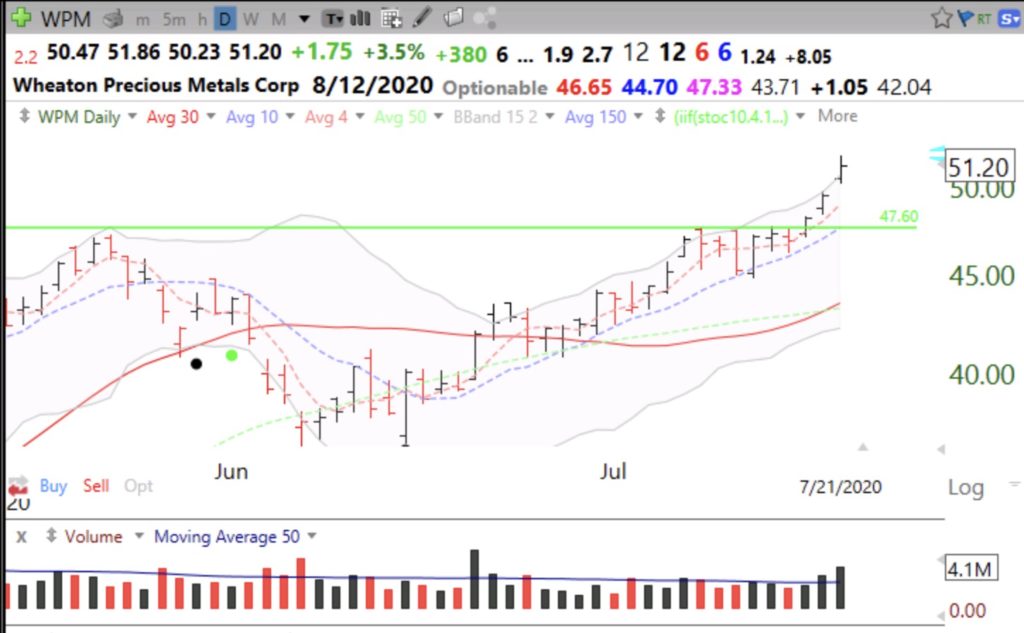
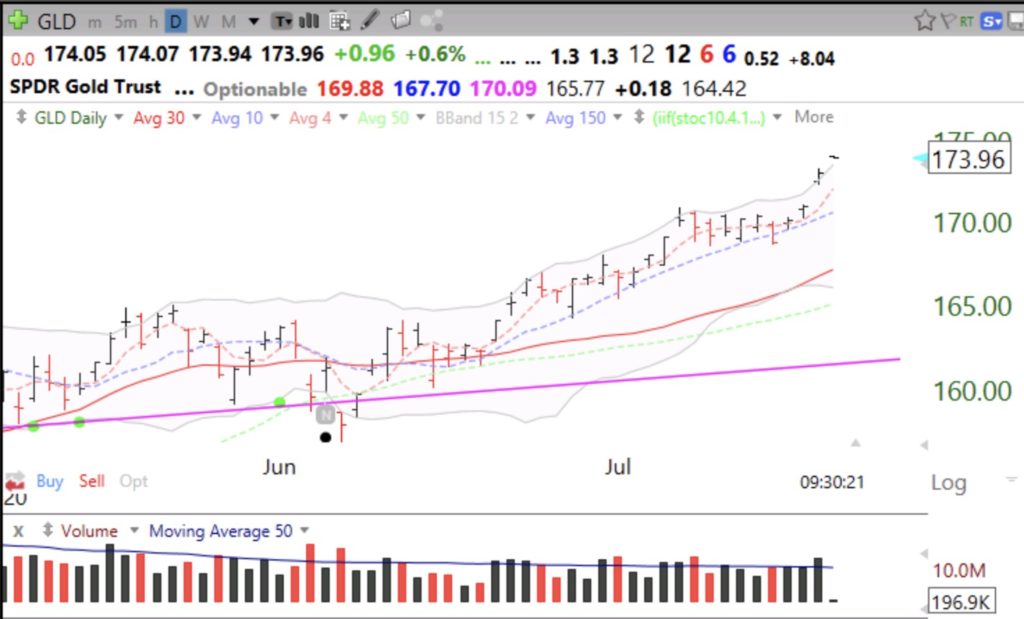
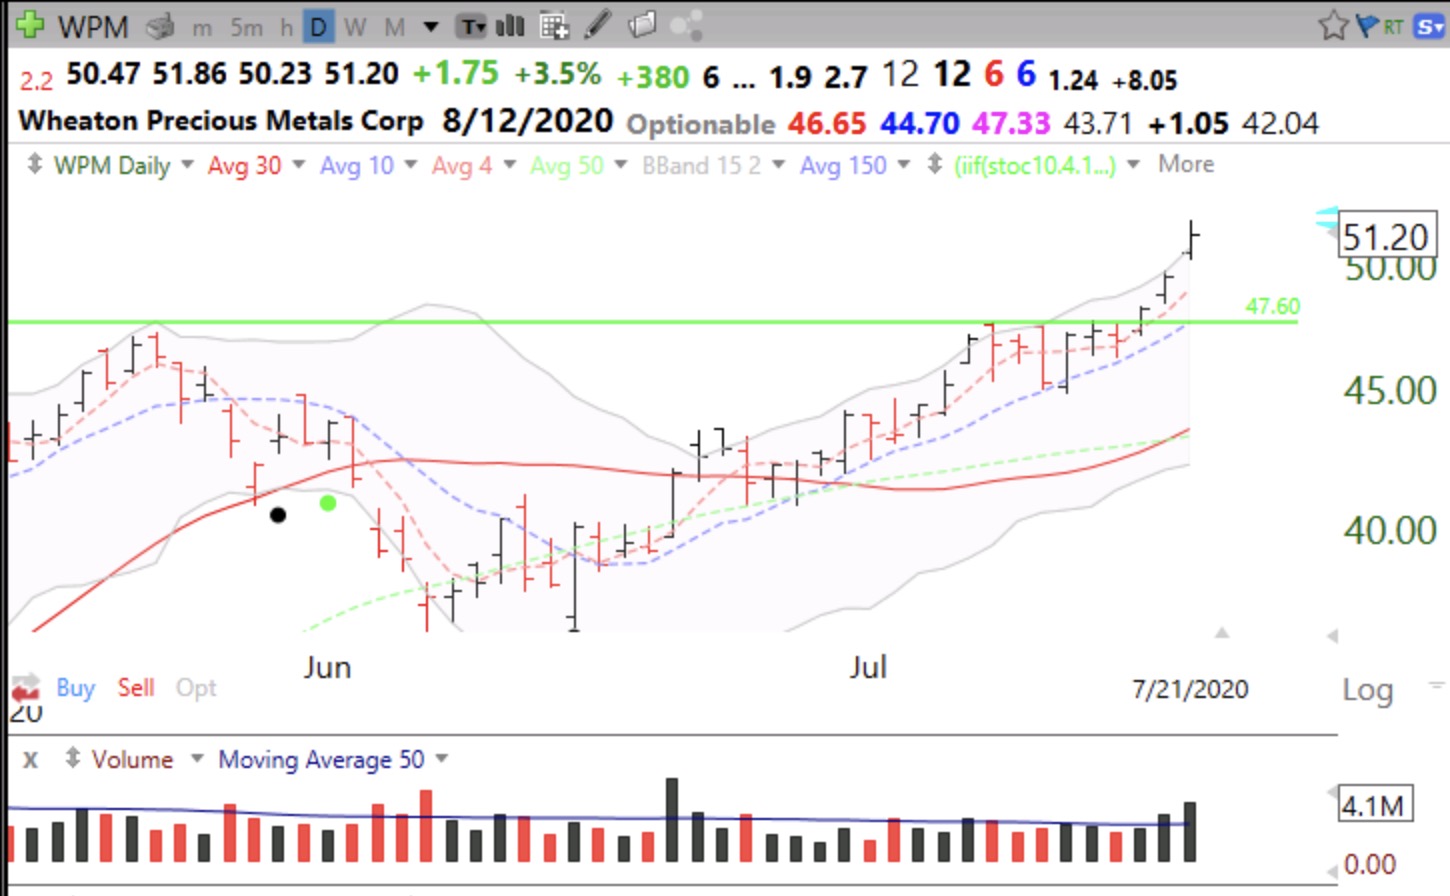
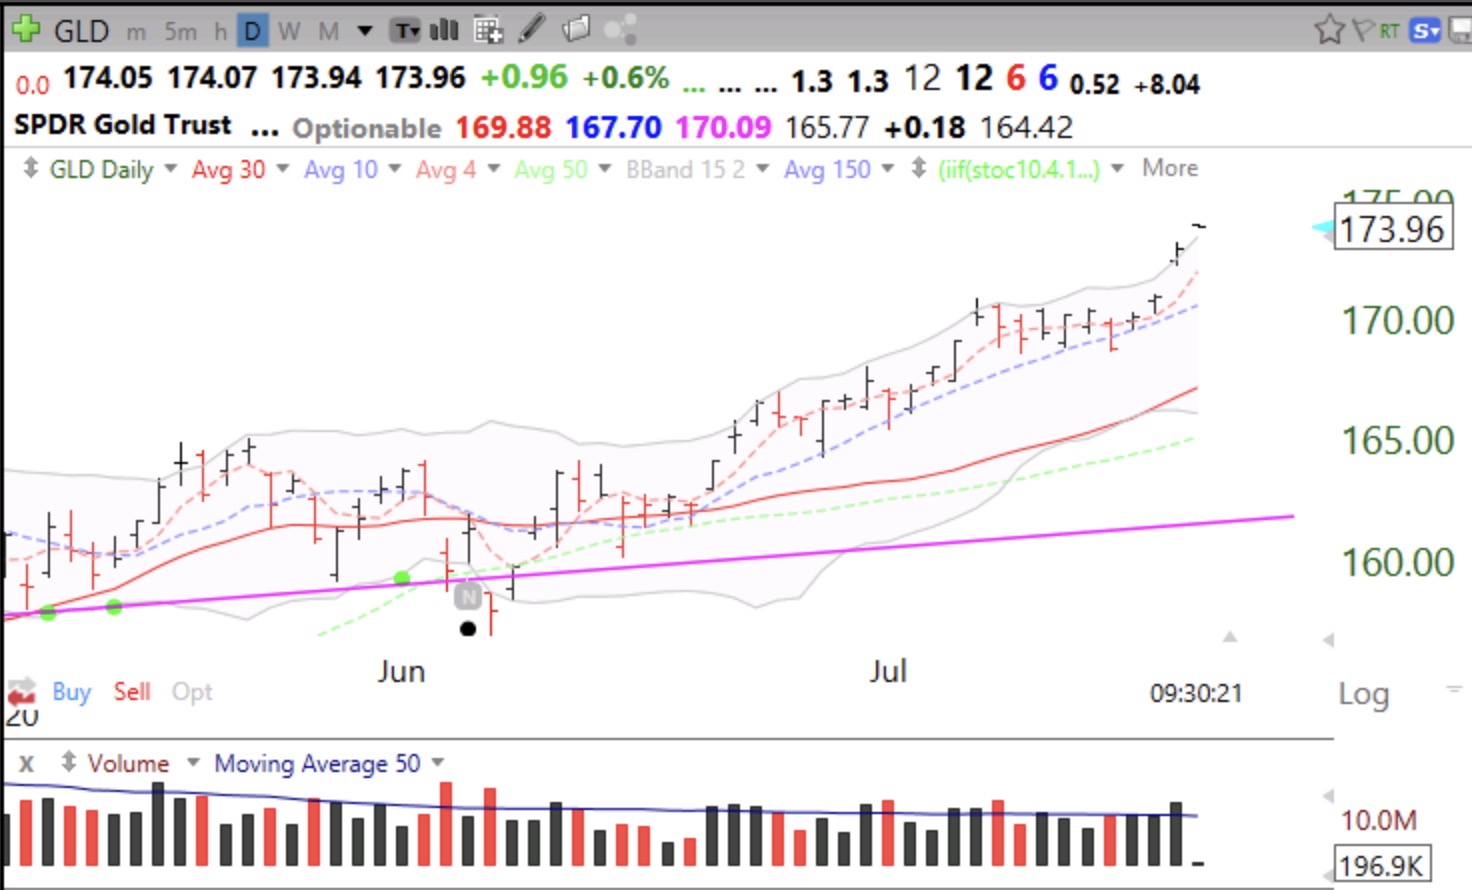
A few days ago I tweeted about WPM, a Canadian mining company, having a GLB, but I noted it lacked above average volume on the break-out. That did not seem to matter. The volume came in the next 2 days. Something is going on with precious metals and GLD, which is also rising. Rising gold often is an ominous sign.