The set-up of a bounce off of the 10 week average: $TEAM

GMI5/6
GMI-25/9
T210852%

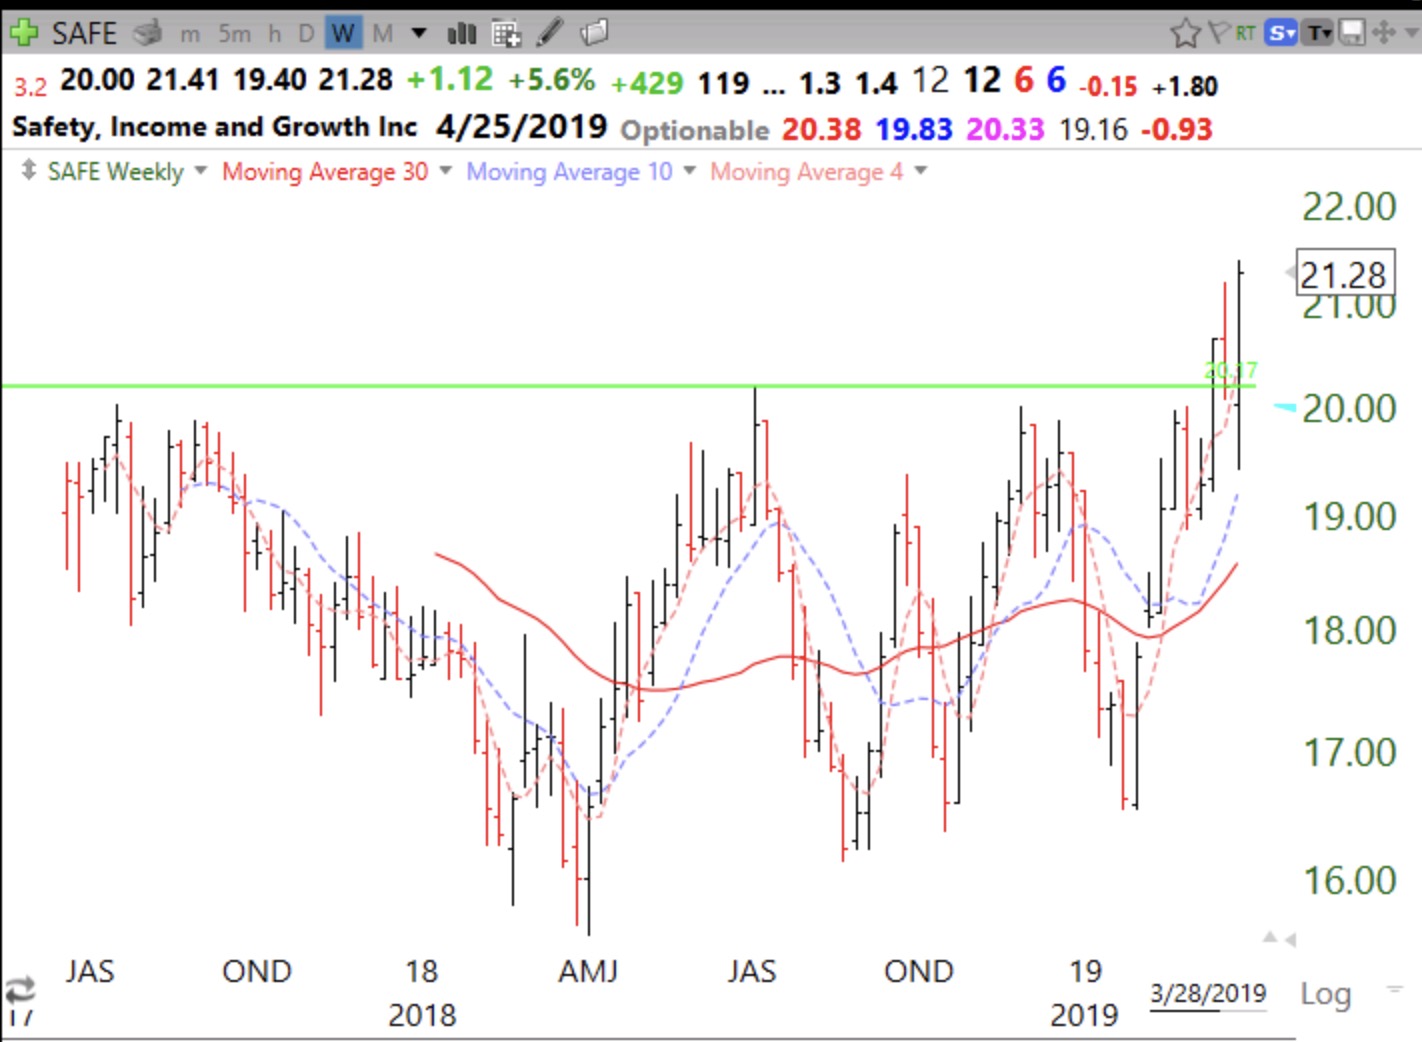
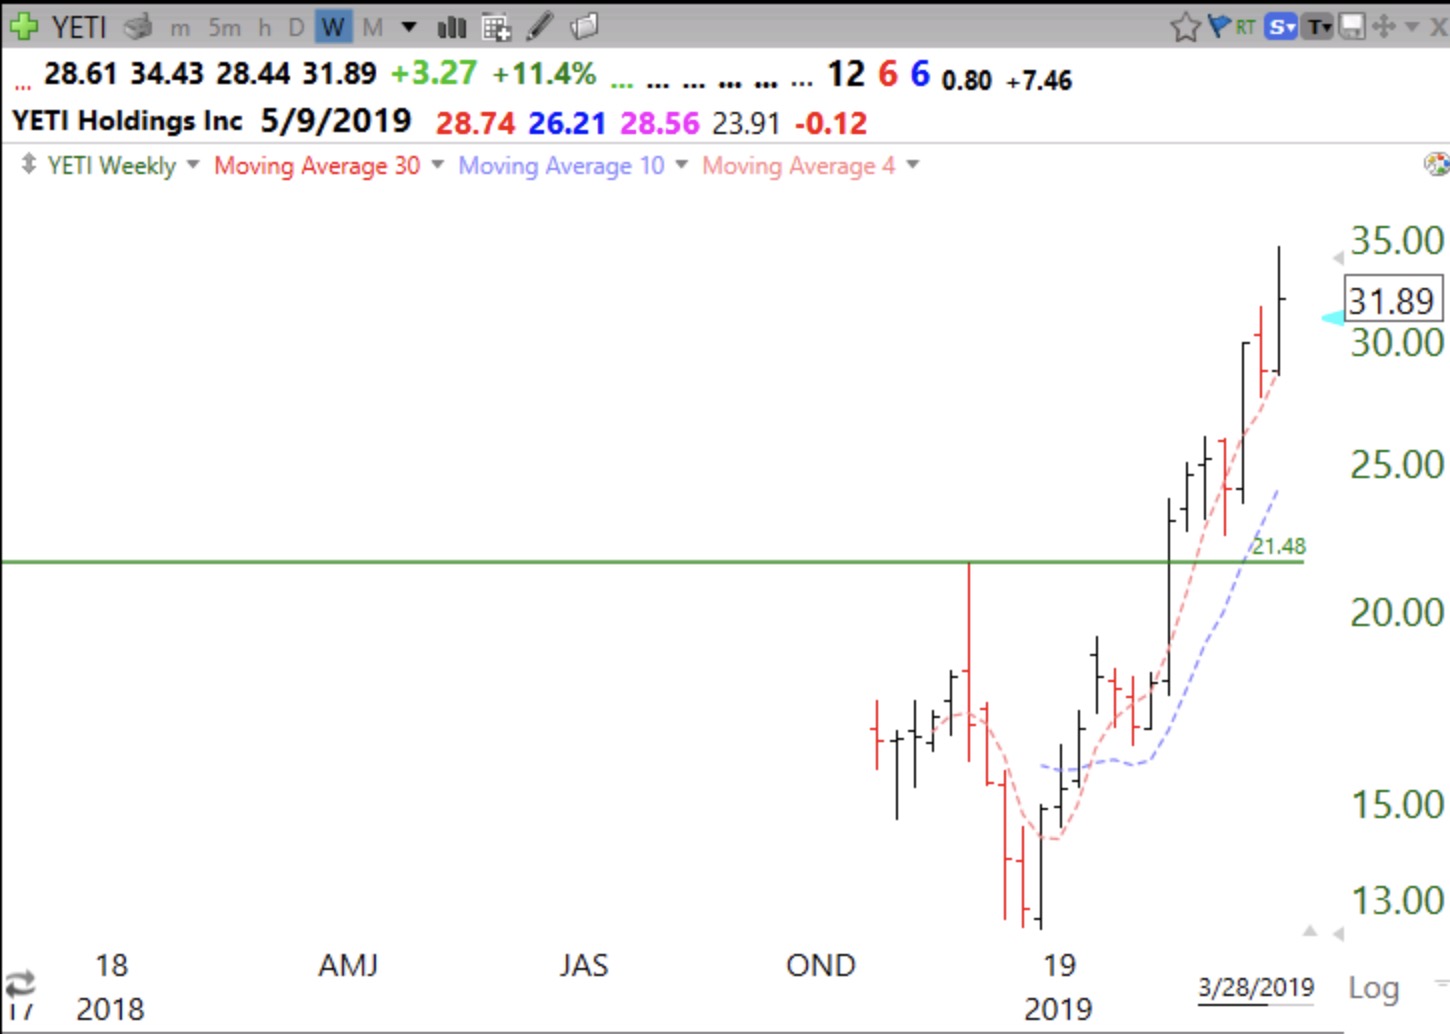
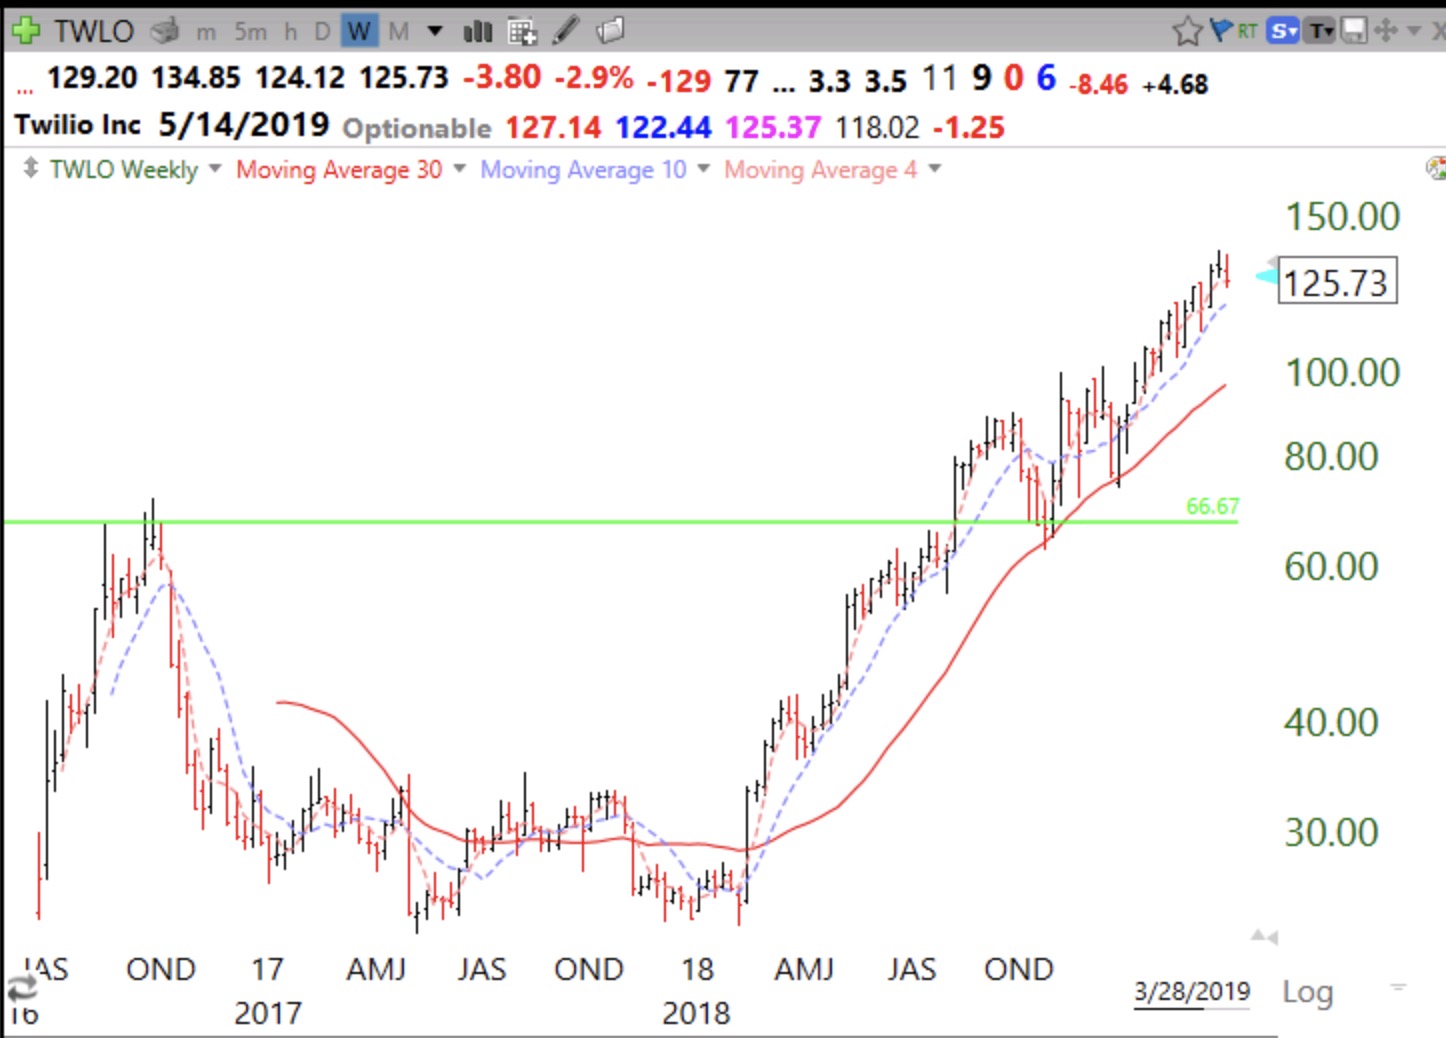
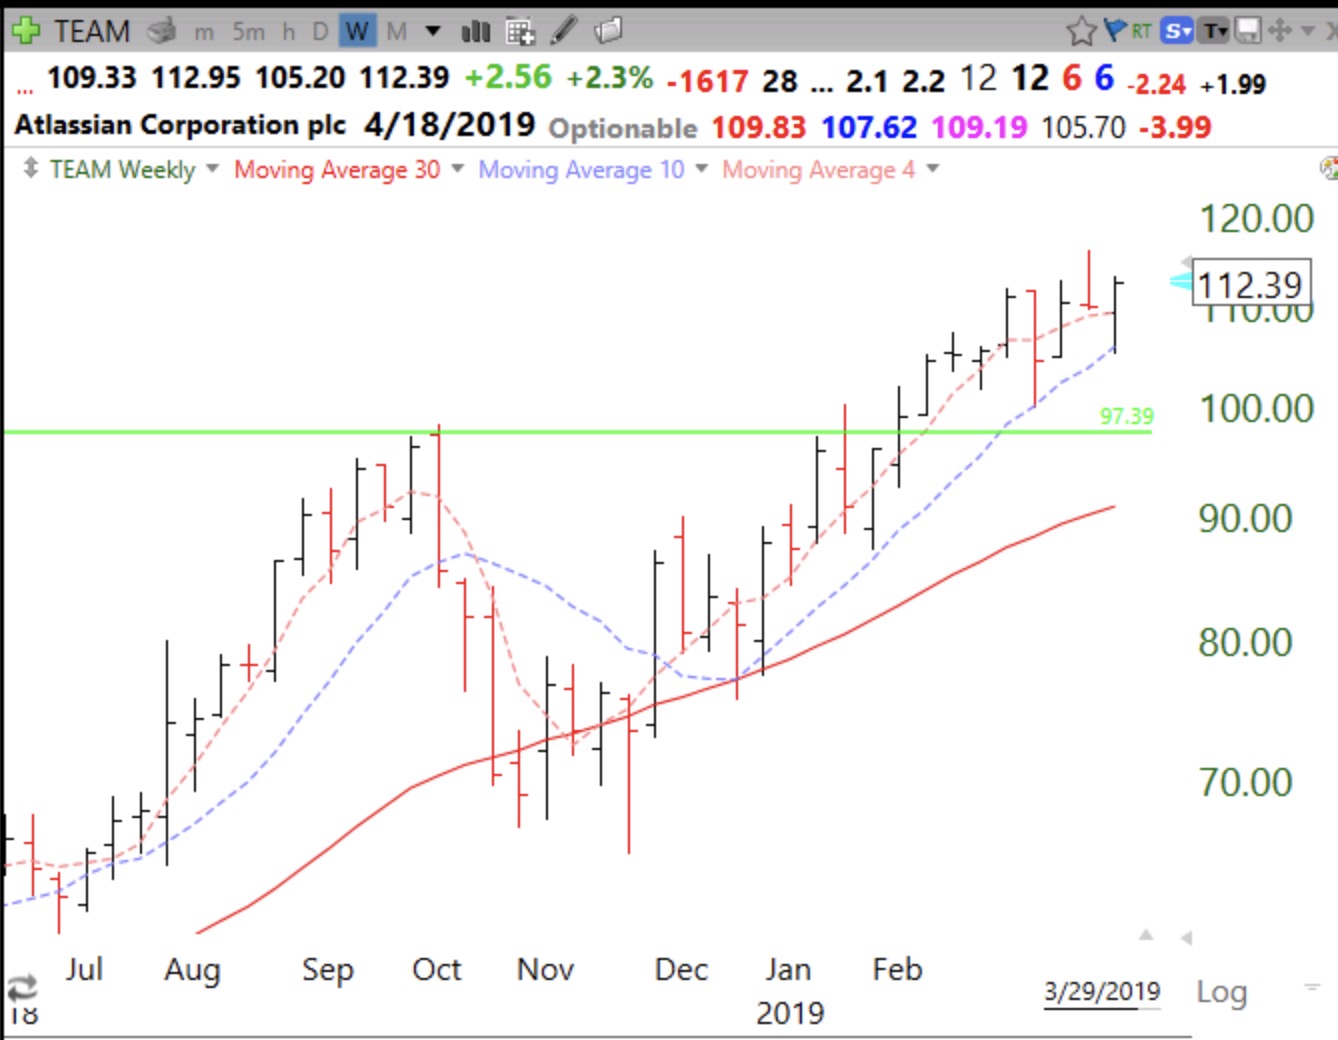
A nice set-up on a weekly chart is when a stock in an up-trend (10 wk average rising above 30 week average)  bounces up off of its 10 week average. It also helps if the stock has had a recent GLB and is trading near its ATH. A good example of this set-up was TEAM last week. If I bought this set-up, I must sell with a weekly close back below the 10 week average. Note how this set-up would have played out last August-September. (10 wk avg is blue dotted line)

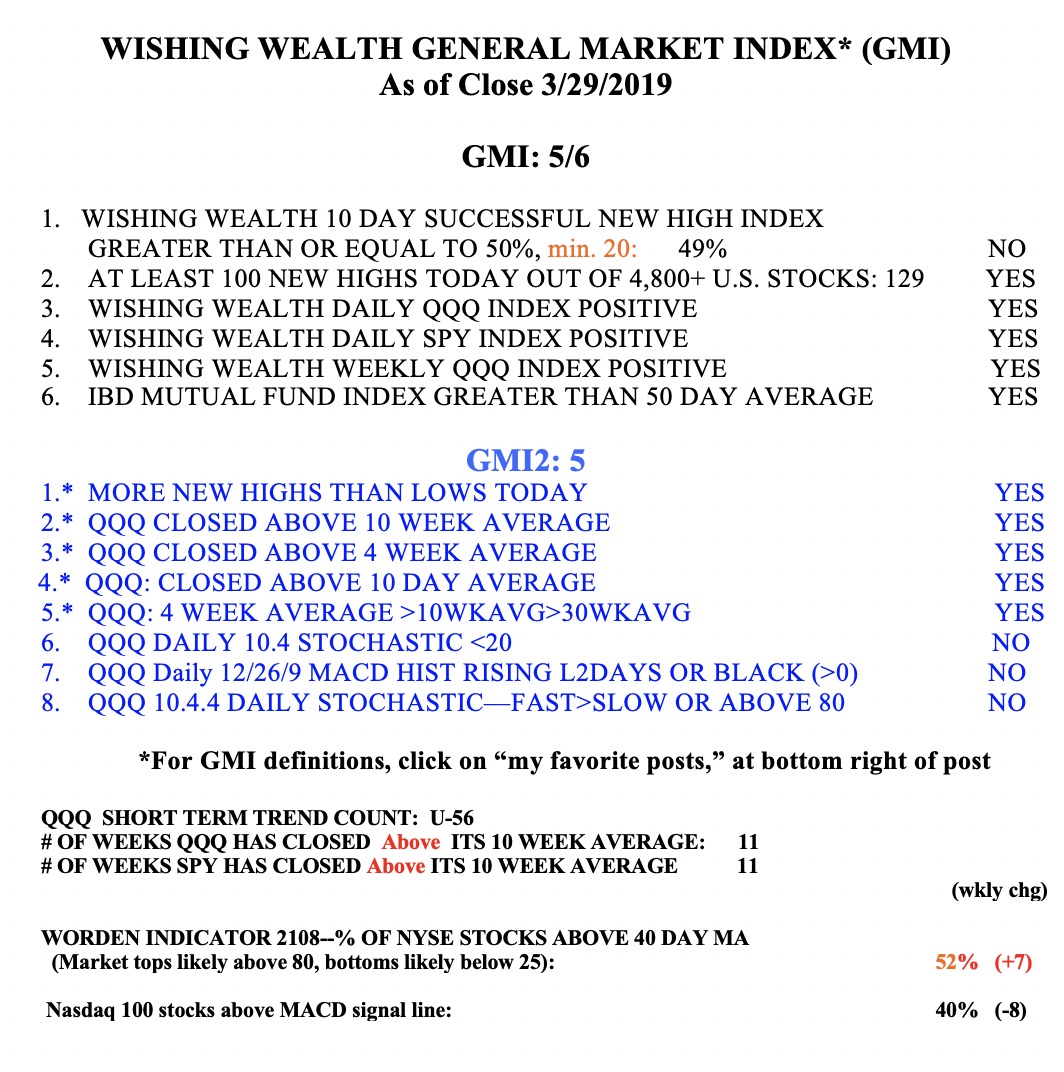
The GMI remains Green.

Buying IPOs with a recent GLB: $SAFE $YETI $TWLO

GMI5/6
GMI-24/9
T210851%

I like to buy recent  IPOs (within last 4-5 years) that form a multi-month top and then break through on above average volume to an all-time high. In my jargon, they have had a GLB (green line break-out). I like getting into a newly public stock because it has a lot of room to gain as traders see the new highs and jump on board. By the way, I never hold a GLB that closes back below its green line, but I often will repurchase it if it closes back above its green line. In a future post I will tell you how I use TC2000 to find these gems. Below are a few examples of IPOs that have had a successful GLB.