I created a scan in TC2000 that looks for strong stocks hitting a 100 day high that did not hit a 100 day high the prior day (I want a stock to be just breaking out), that is up significantly from a year ago and that traded an above average number of shares that day. This scan identified 19 stocks, of which PJC is one.
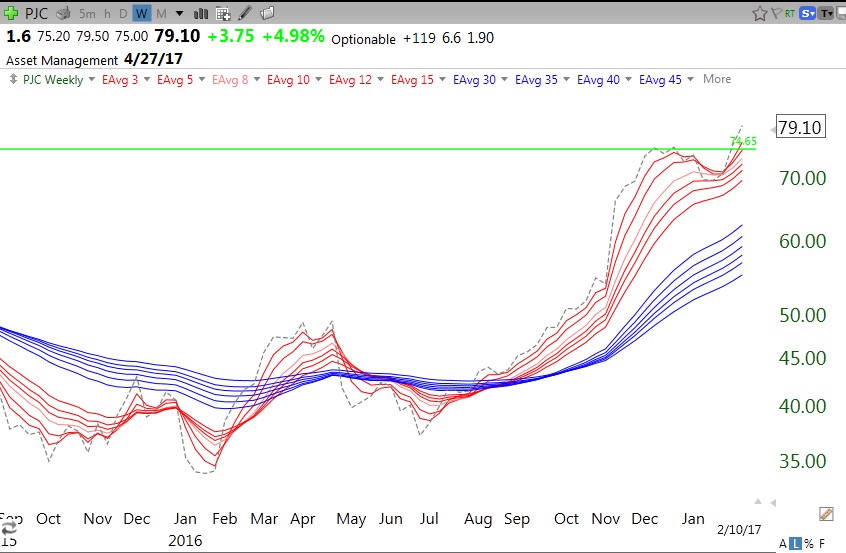
I like the the technicals and fundamentals of PJC. It also has a Composite Rating in IBD=95. You can access this scan in my TC2000 Club at www.wishingwealthblog.com/club. The scan is also described in my blog’s glossary above. I use the results of my scans as a starting point to identify strong stocks that I must then research for other technical and fundamental attributes. I like to run this scan during the last hour of the trading day (I do not want a stock that breaks out early only to reverse by the end of the day) to find stocks breaking out on above average volume. If I find one I like, I might buy an initial position and place a sell stop below the day’s low. Here are some charts on PJC. This weekly chart indicates a GLB (Green Line Break-out to an all-time high, see Glossary for definition).
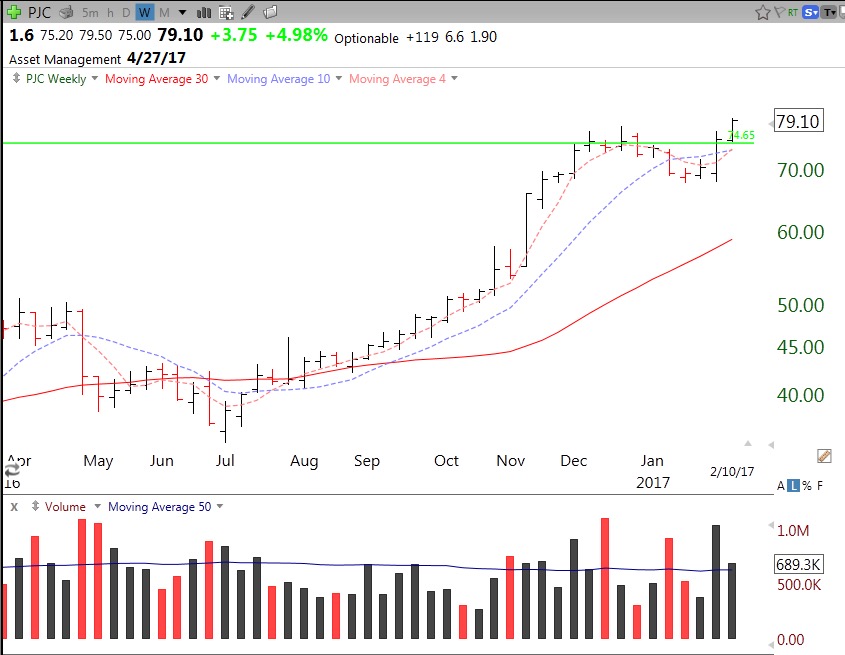
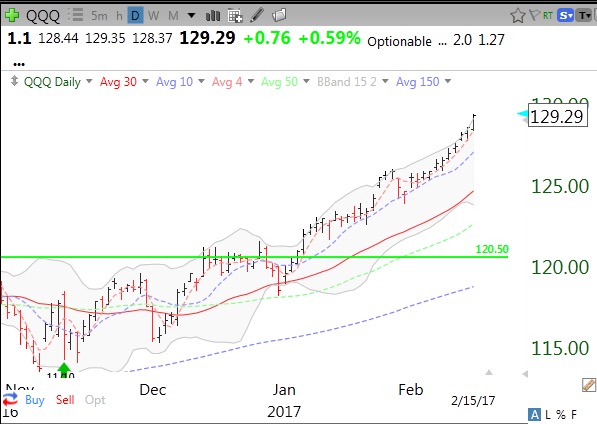
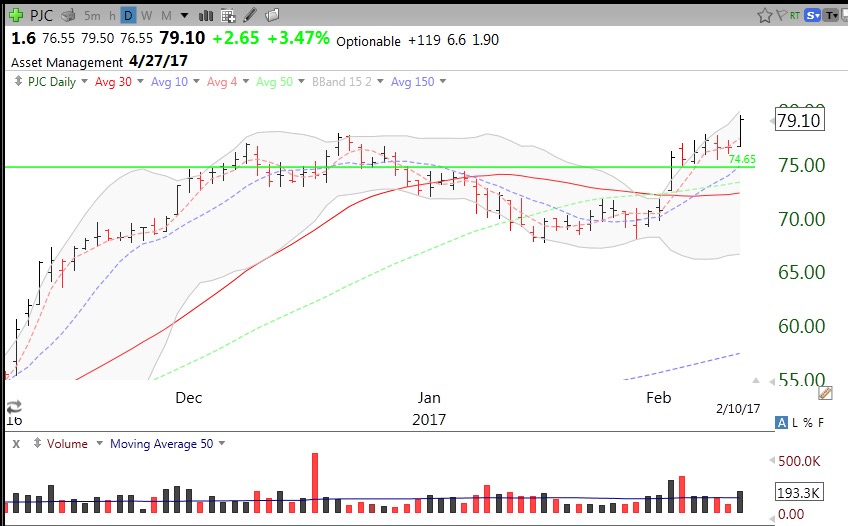
The daily chart shows the increased volume on Friday. This might be also be considered a cup with handle break-out.
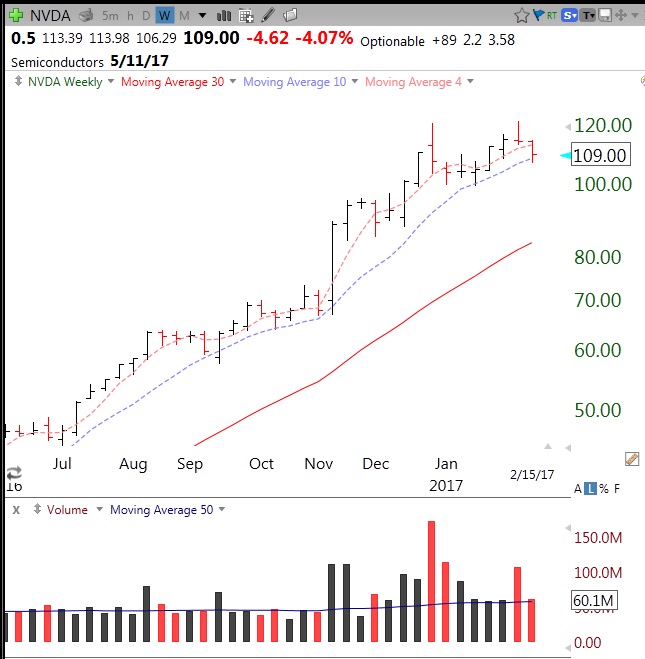
The weekly chart shows an established RWB rocket pattern and a break-out from a base.
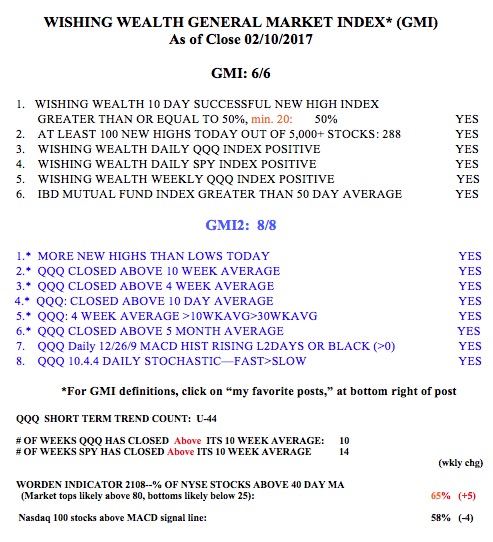
The GMI remains at 6 (of 6).