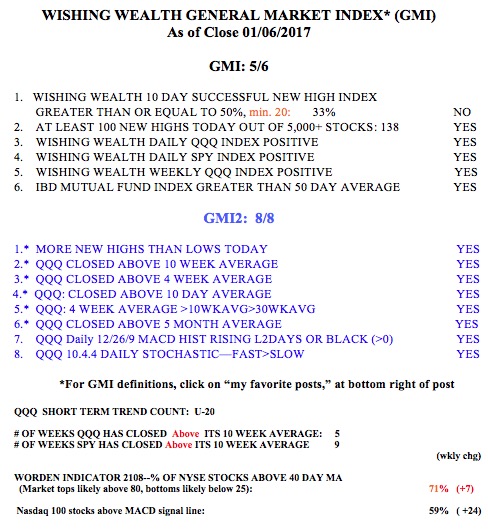
The GMI is at only 5 (of 6) because my 10 day successful new high indicator was negative. Only one third of the stocks that hit a new high 10 days ago closed higher than they did 10 days ago. When stocks that hit a new high do not continue to rise, it is one sign of potential weakness I track. The QQQ has closed above its 10 week average for 5 weeks but the SPY has done so for 9 weeks. As you know, the tech stocks measured by the QQQ, have just recently revived. In fact, the QQQ last week broke above its high of 120.50 reached in April 2000. The QQQ closed the week at 121.93. So those persons who say they never take a loss because the market eventually comes back are vindicated–if they held on for 16 years! (I wonder how many of them started out as buy and hope types but panicked and sold out as the QQQ bottomed at 19.76 in October, 2002 or again at the 2008 bottom at 25.05?)
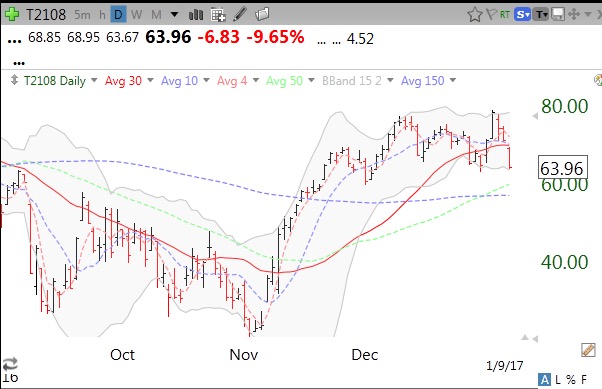
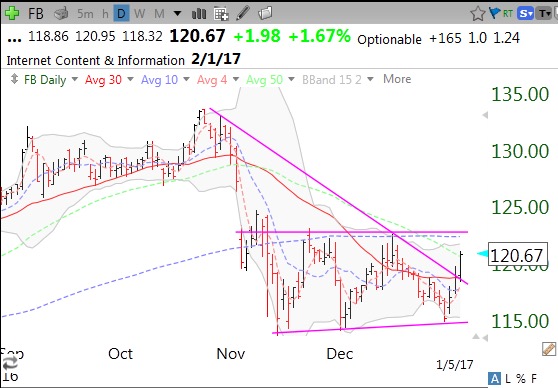
The fact that the QQQ did close the week above 120.50 is a sign of strength. However, there are a few things about this rally that concern me. I track many statistics each evening after the markets close. I noticed that only 138 of almost 5,000 stocks hit a new high on Friday. This is far below the numbers seen in much of December. On December 5-12, the number of stocks hitting new highs each day ranged from 430-908. The last 5 days the range was 88-306. So while the QQQ may trade at an all-time high, new highs are not keeping up. On Friday, only 39% of all stocks rose, compared to about two thirds of the Nasdaq 100 stocks reflected in the QQQ. So there is tremendous heterogeneity in the way stocks are performing. Maybe, as I wrote last week, it is time for the tech stocks to rally as the other stocks rest. People have made some money and may be more willing to increase their risk to buy the FANG stocks (FB,AMZN,NFLX,GOOGL). Regardless, I must ride the trend until it ends. You know better than to ask me (or anyone else) to predict when that will be. As they say, bull markets are like sex, they feel best just before they end……
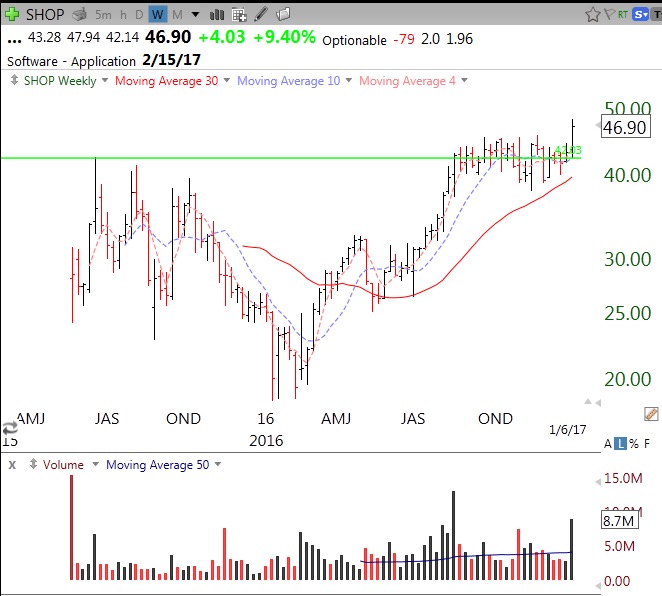
Last week a TC2000 alert I had set went off but I did not notice it until this weekend. SHOP convincingly broke above its green line (GLB) to an all-time high, after consolidating about 4 months around its green line. This chart shows a wonderful high volume break-out last week in SHOP, an IPO from 2015. SHOP is probably worth looking into as it connects with Amazon. If I bought it I would exit if it returns below its green line.
Here is the GMI table: