Bouncing off support: $TTWO $CBAY $CAI $PII $SKX $OSTK $ALNY $PVH; window dressing coming
Below are 8 stocks that are in up-trends and have found recent short term support. The third column shows the percentage above support the stock is as of Friday’s close. Note that OSTK is 26% above support and may therefore be extended. I am monitoring these stocks for possible purchase this week, unless support fails.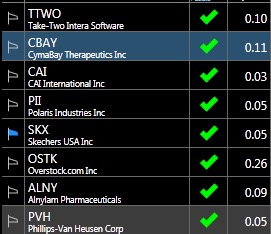
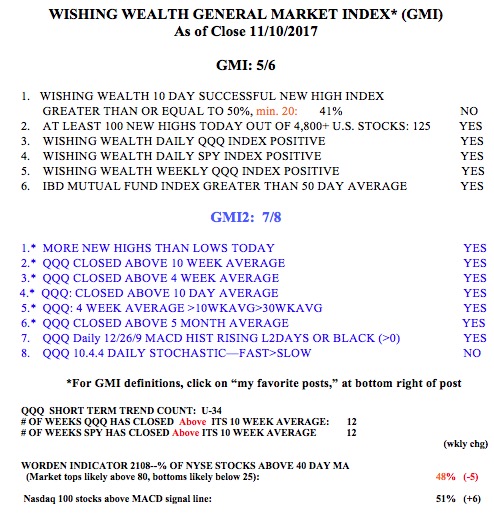
The GMI remains on a Green signal. Note, however, that we are in a post-earnings release lull when stocks often go sideways or down. This weakness would likely set the stage for the end of quarter and year window dressing rally, when mutual fund managers purchase the strongest stocks so their quarterly reports to shareholders make them look like smart stock pickers…