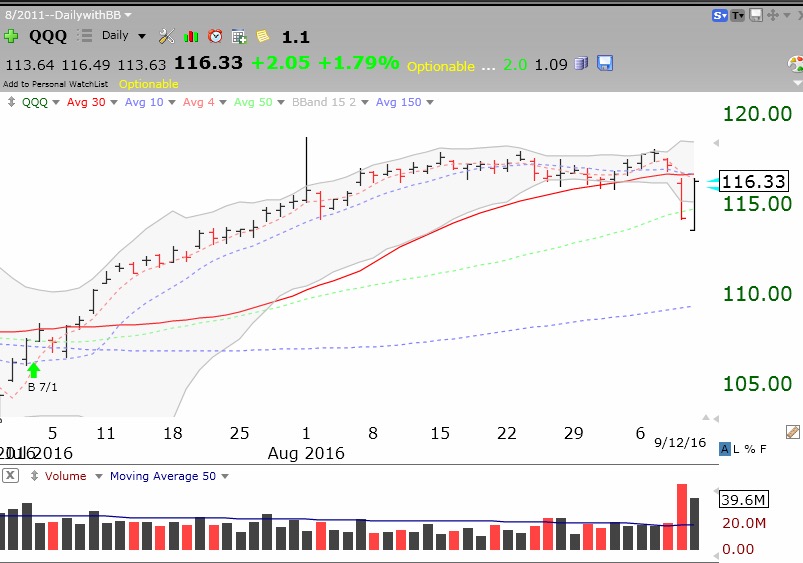
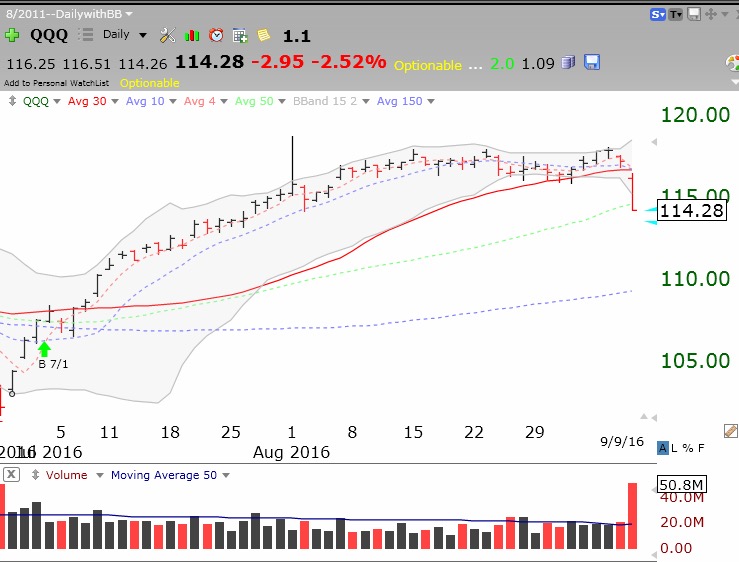
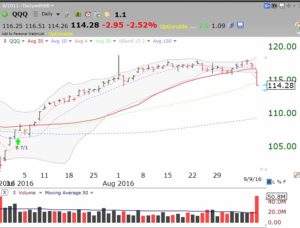
I have been writing for a long time that September is historically the weakest month of the market and more recently that the major indexes have been consolidating within their narrowing upper and lower Bollinger Bands. Well, the market finally tipped its hand on Friday and broke out into a downward direction. This daily chart of QQQ shows a high volume decline out of the recent channel formed by the 15.2 daily Bollinger Bands. The expansion (widening) of the bands often signals the beginning of a major move. Large declines on Fridays often lead to ugly Mondays when the public gets a chance to sell after pondering their portfolio losses over the weekend. So, where to now?
Bottoms often come in October when it may take 3rd quarter earnings release season to revive stocks. We are now in the post 2nd quarter earnings release lull and a decline typically sets up the next earnings propelled rise. So how can we know when the market is likely to begin a sustainable rise?
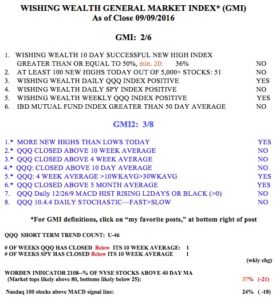
I watch several indicators very closely when the market enters a decline. If the daily put/call ratio, a contrary indicator, gets to 1.2 or greater the market often bounces at least for a day or so. The p/c ratio closed at 1.14 Friday, not too far from denoting an extreme level of bearishness by option traders. But the poll of newsletter writers, another contrary indicator, shows many more bulls than bears, a bearish sign.
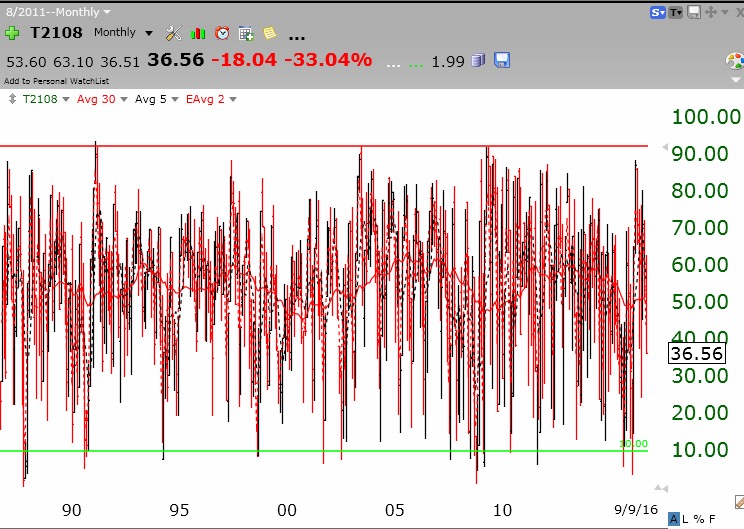
The Worden T2108 indicator measures the percentage of NYSE stocks that closed above their simple 40 day moving average of closing prices. I consider T2108 to be a pendulum of the market and post it here every trading day. As this monthly chart shows, since its inception in 1987, T2108 rarely falls into single digits or climbs above 90%. I drew in red and green lines to show these extreme levels. When T2108 declines to 10% or lower, it is a screaming signal that the market is extremely oversold and near a bottom. I typically do not have the courage to buy stocks when that occurs because stocks are falling rapidly and the media pundits are typically predicting economic Armageddon, but I will consider buying a market ETF, like SPY. The market, unlike individual stocks, has always come back. Major declines in 2016 ended with T2108 at 6% or less. T2108 closed Friday at 37%, far from an extremely oversold reading.
I also look at the daily 10.4.4 stochastics indicator. The major indexes tend to bottom at least short term when their daily stochastics readings fall below 20. On Friday the stochastics for QQQ was 61, 60 for DIA and 64 for SPY, all far from oversold levels. While the market can do anything, I think we are currently closer to the beginning of a decline than to an end. But Mr. Market often proves me wrong. I remain a trading chicken. So for now my trading accounts are in cash….
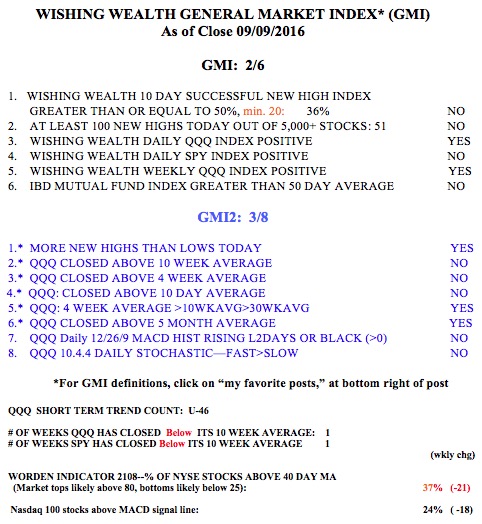
A flat or down day on Monday will end the QQQ short term up-trend, it having lasted 46 days through Friday. More significant, the GMI is now at 2, and two consecutive days below 3 triggers a GMI Sell signal. The GMI helps me to determine the longer term trend of the markets. The QQQ and SPY have also now closed below their 10 week averages, a significant indicator of weakness. I rarely can make money buying stocks when QQQ is below its 10 week moving average.