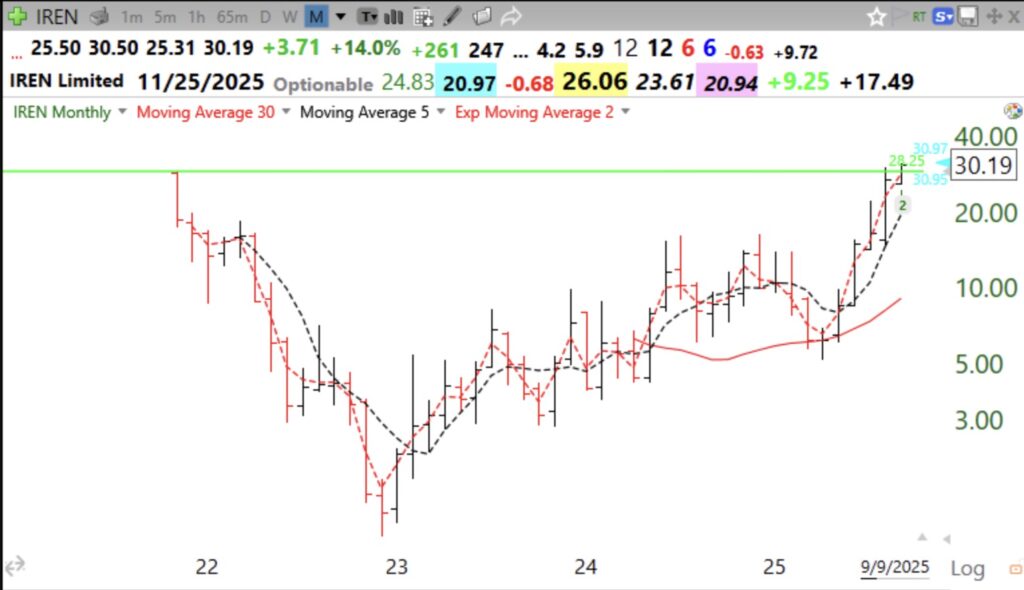
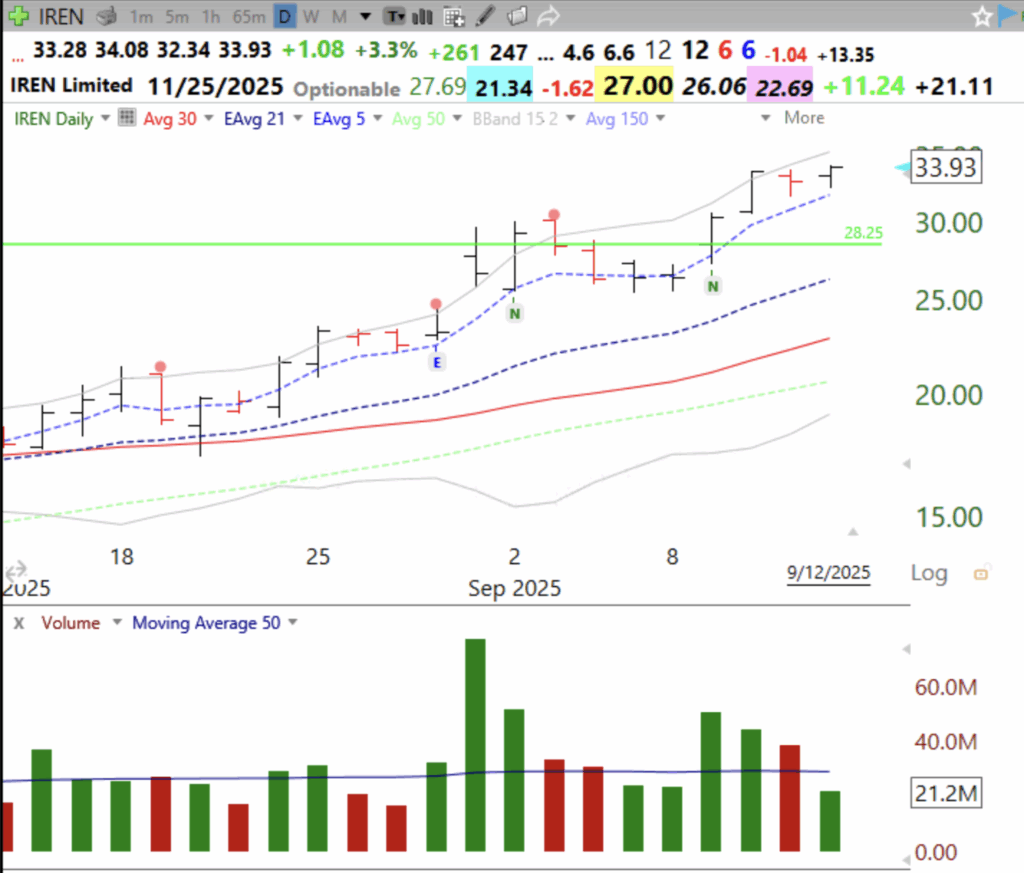
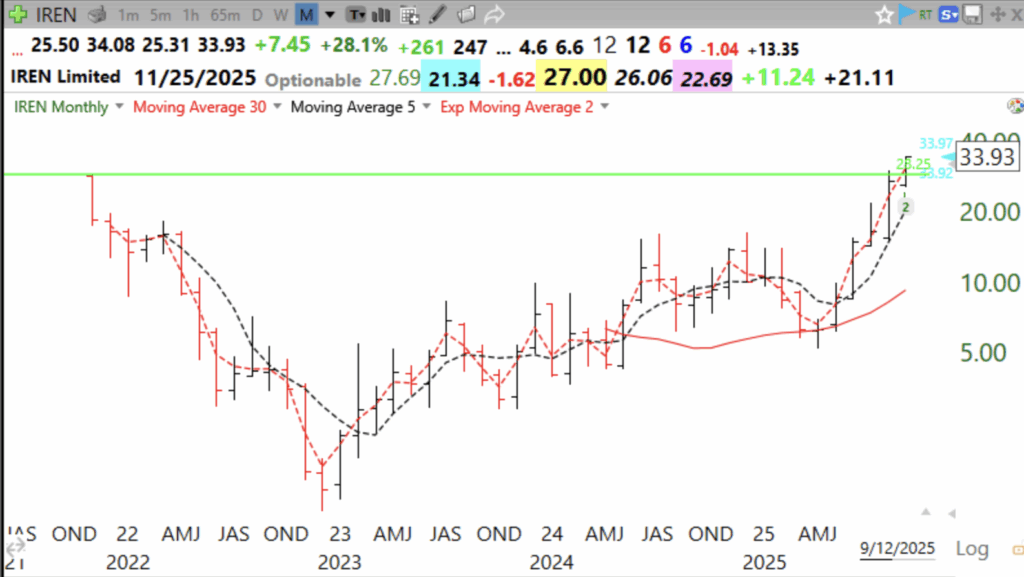
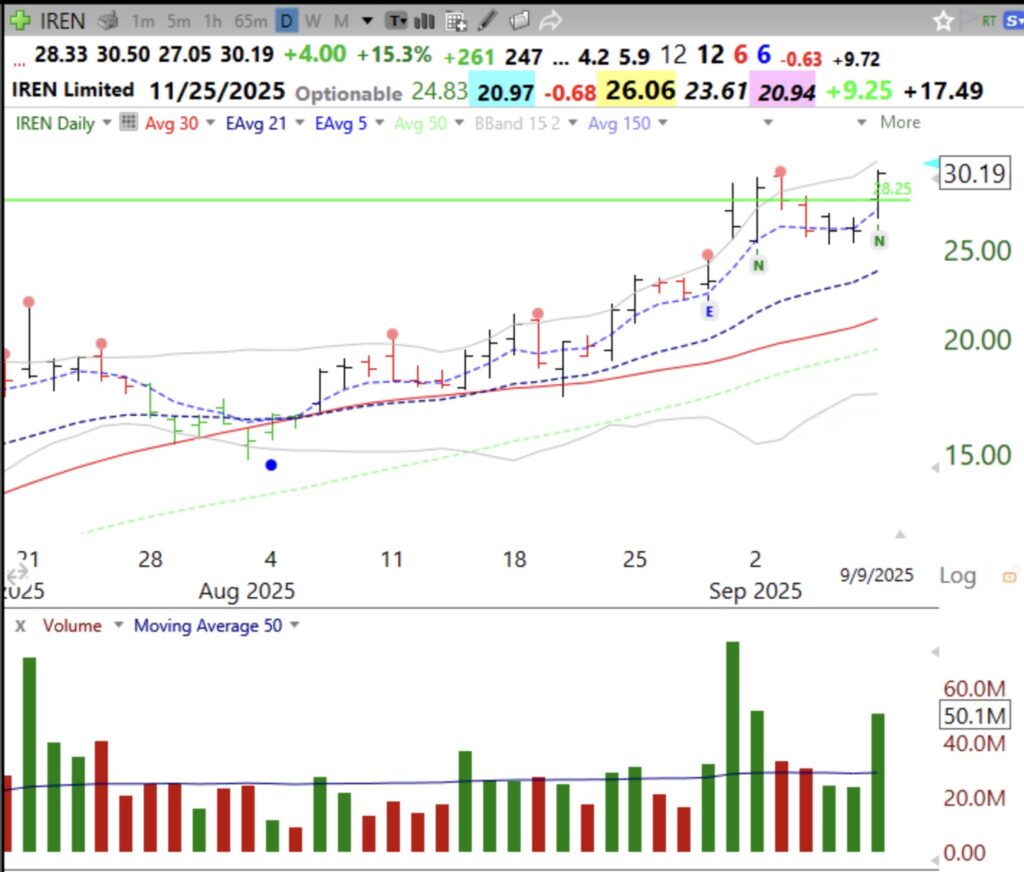
Even though the longer term trends are not up, the fact that the daily adapted Guppy chart has an RWB up-trend suggests to me that it is okay to buy some longs. I will feel more confident when the QQQ’s 10 wk avg crosses above its 30 wk average. However, the 30 wk average is starting to curve up. That is a good sign.
Screenshot
Weekly 10:30 chart. 10 wk avg=dotted; 30 wk avg =red line; gray line is weekly close.
I am concerned that there were more US stock new lows than highs on Friday. In addition, SPY closed below its declining 30 week average. This could be a deepening Stage 4 down-trend, especially if it cannot close this week above it. IWM and DIA look even weaker. However, QQQ closed above its flat 30 week average. So which index is the leader? I think this week’s action should tell us. Meanwhile, I own a little GLD and IBIT (GLB last week). I will exit quickly if weakness materializes. GLD has been nicely tracking my blue dot bounces, see daily chart. I explained my Blue Dot of Happiness indicator in my presentation last week to the Boston IBD meetup. You may sign up for the wait list for my future Masterclass with TraderLion here.
Screenshot
The GMI=5 (of 6) but look at how my most sensitive components in the GMI2 are weakening.
I am sorry that only the first 500 attendees coud listen to me live. Still, all who registered will be receiving the free recording. It was an exciting experience.
Last night I introduced the attendees to my Blue Dot of Happiness indicator. I neglected to say that my great stock buddy, Judy, had suggested that title. I promised to reveal the scan I have on TC2000 to find stocks with a Blue Dot. If you do not have TC2000, you can get a discount coupon to try it out, on the tab at the top of this blog. I receive an incredibly small fee (tip?) for each enrollee. I have been using TC2000 for about 20 years and understand the programming language. They have a great help section of tutorials and a support team (support@tc2000.com) that help people learn the system. So while I will show you my scan, you might need their help to set it up.
First of all, you can add a dot to your daily charts by adding this indicator to the chart.
Right click on the chart and select add to chart and then indicator. Then complete the box below.
Screenshot
Note the first letters before the parenthesis are IIf. This line says If the 10.1 stochastic is now >20 and yesterday’s was below 20, put a dot 1 dollar below the current day’s low price. Fill out the rest of the box as I have. And make sure you are on a daily chart.
The above just makes sure you have blue dots on the day the 10.1 daily stochastic crosses above 20. But I want to scan for stocks that do that and also meet other criteria. Here is my current filter scan. It is set to mixed because my program’s lines access daily and monthly time frames.
Screenshot
Stocks with a blue dot over the last 3 days; Above 20 today but below yesterday or the day before.
V>20000
Price history 250 month high set to monthly , 250 bar high and and within last 3 months or bars. Price New High is a condition built into TC2000 that you can access. I assume most stocks meeting this are at an ATH within the last 3 months.
C>15 stock must be at least >$15
Stoc1.1>50 means the stock price is in the top half of its current day’s price bar
Low price today or yesterday or the day before -1 was <= the lower 15.2 Bollinger Band (optional)
I scan a watchlist of growth stocks that have been on the IBD50 or MarketSurge stock lists.
I then look at the stocks that survive these conditions for earnings date and fundamentals and other criteria.
If you sign up for my course you will learn all of this.
Screenshot
Have Fun!! I may change the above settings anytime. You can too.
By the way, if QQQ should close back below its 30 week average (501) I will exit all stocks again.