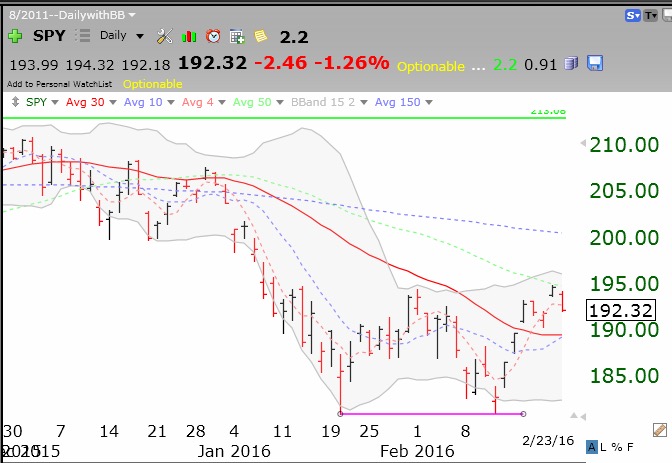
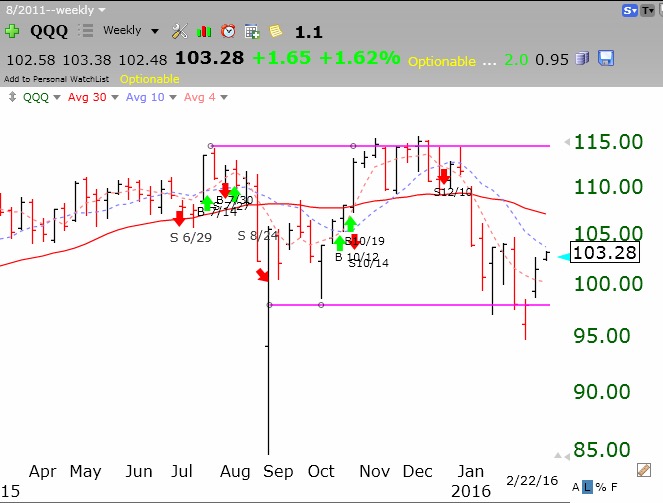
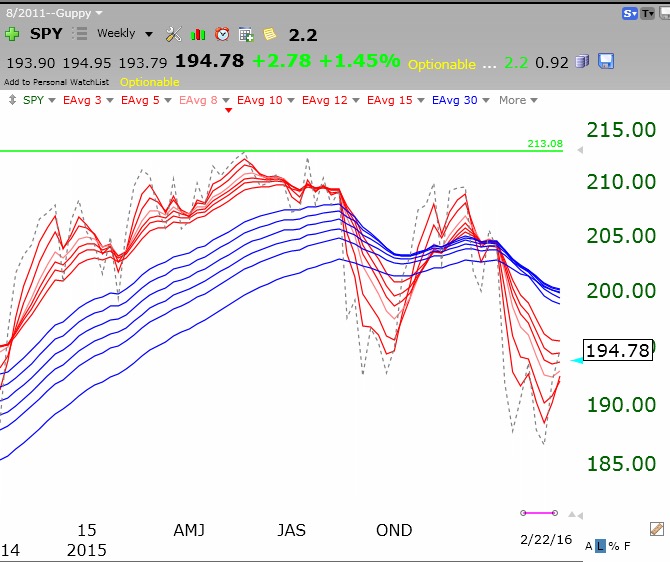
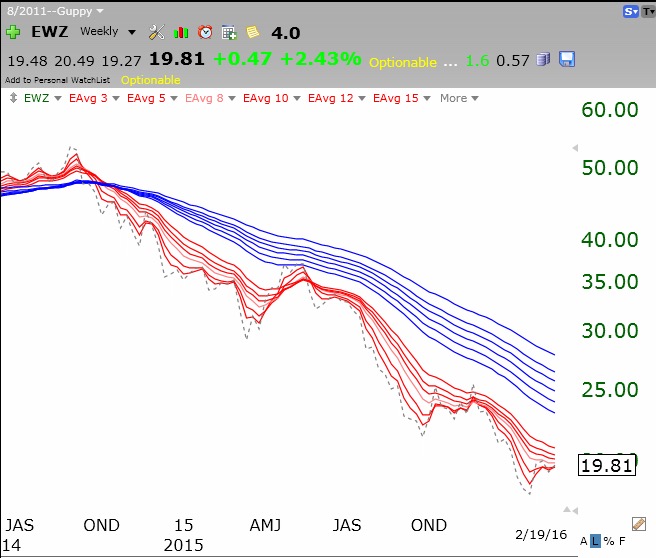
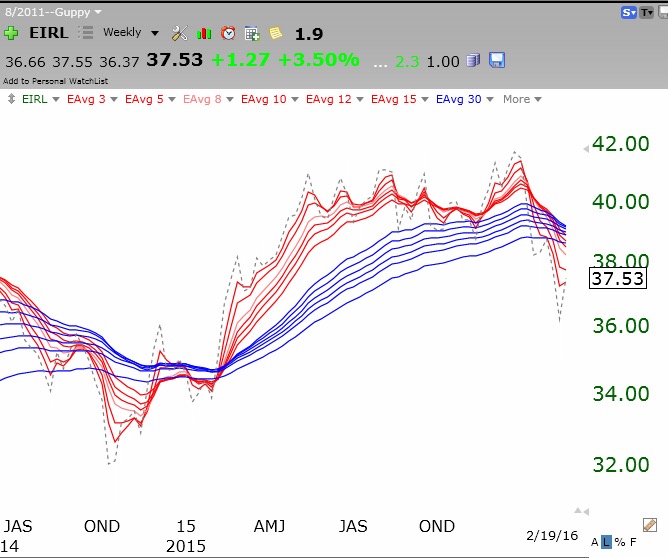
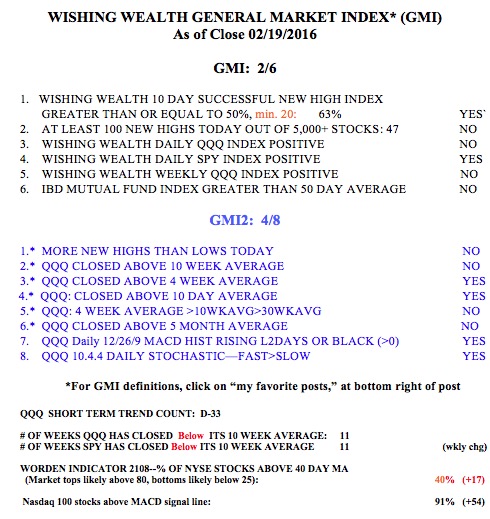
I presented a workshop for three hours yesterday to the DC metro AAII meeting, about 80 wonderful attendees. I taught them how I use modified GMMA charts to determine the general market’s and an individual stock’s major price trends. I then showed them that the QQQ and SPY were in BWR (longer term blue moving averages above shorter term red moving averages with a white space between them) down-trends. I did not show them my watchlist of 38 index ETFs from around the world. All but one, perhaps Ireland (where US companies are moving their corporate homes), are in fully developed BWR down-trends. Here are just a few:
Brazil:
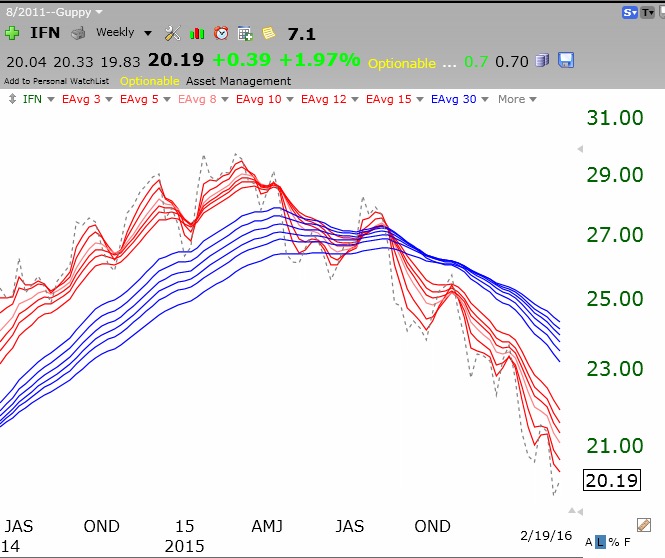
 India:
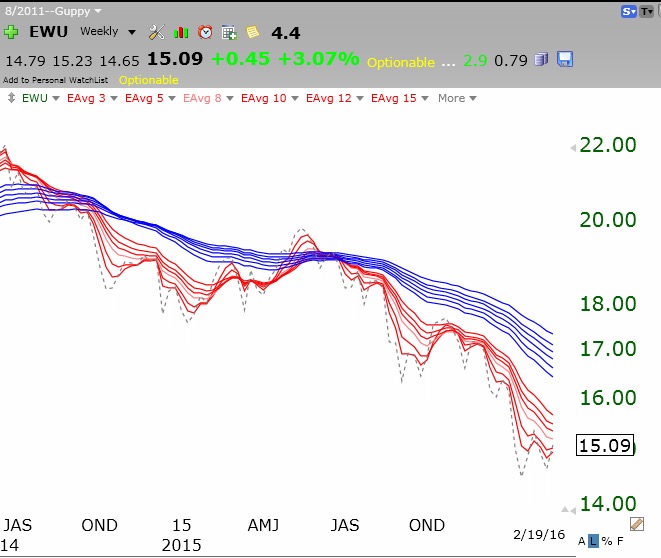
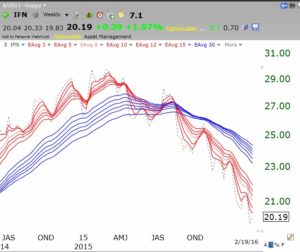 United Kingdom:
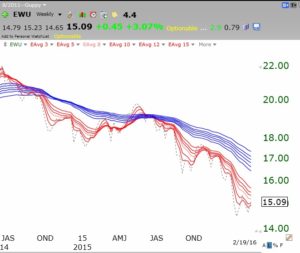 Emerging Markets:
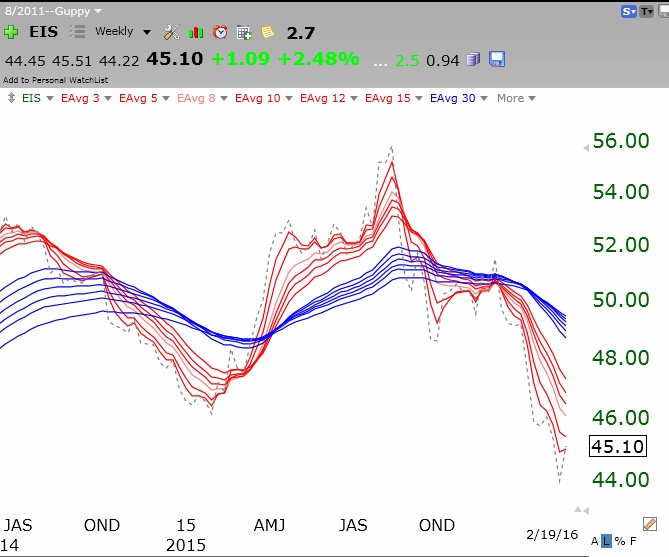
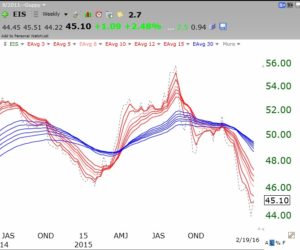
 Israel:
 Ireland is the strongest of all, but a budding down-trend now:
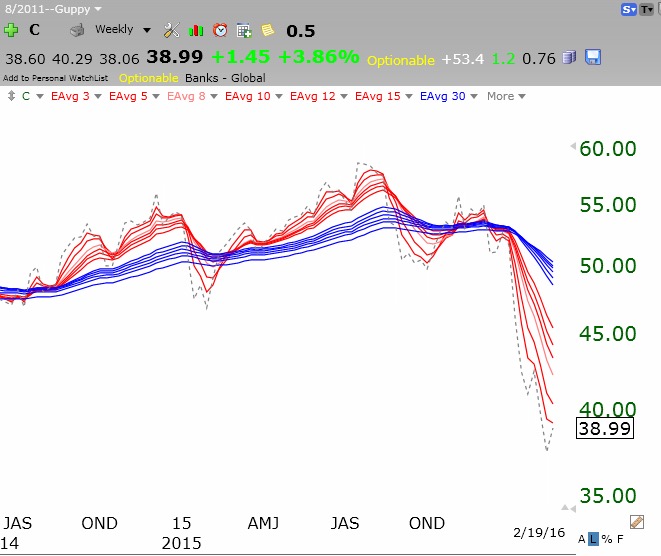
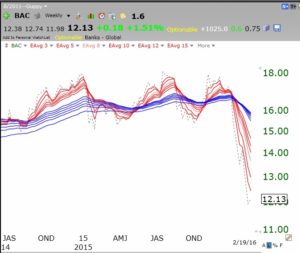
 I could have shown you the others, but you can trust me that 37 of 38 world market ETFs I looked at are in solid BWR down-trends. Are we scared yet? The last time I saw anything like this was in 2007 when all of the bank stocks were in BWR down-trends. How are the banks doing now?
Bank of America, BAC:
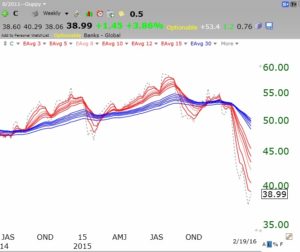
Citicorp, C:
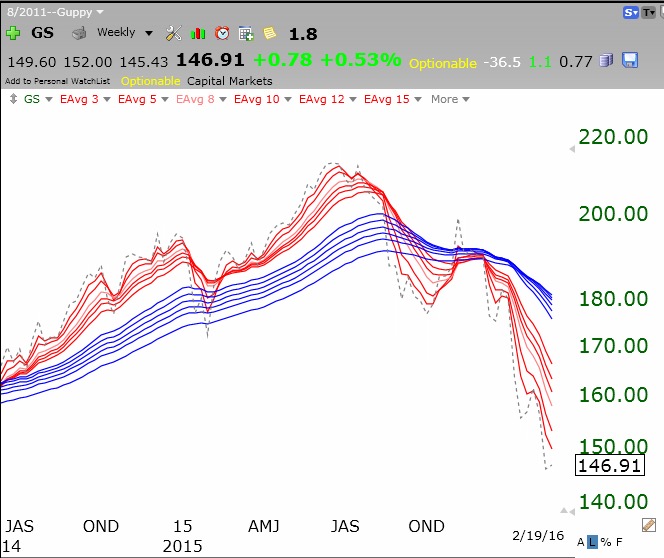
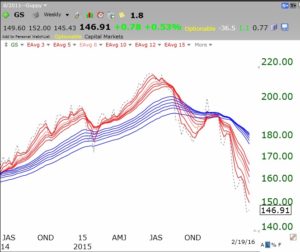
 Goldman Sachs, GS:
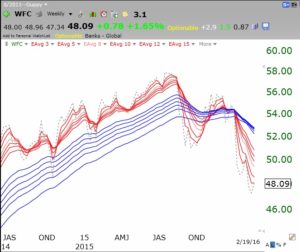
 Wells Fargo, WFC:
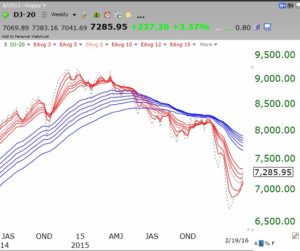
 Are the Dow Jones Transports turning around as some pundits have opined?
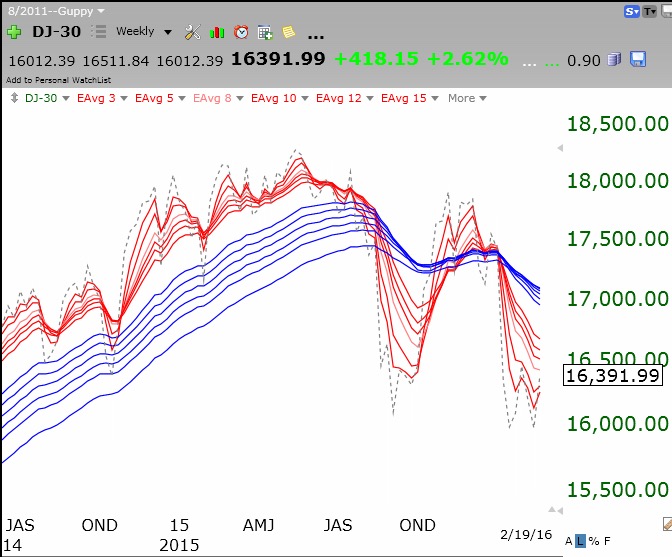
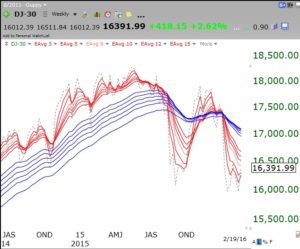
 How about the Dow 30 index?
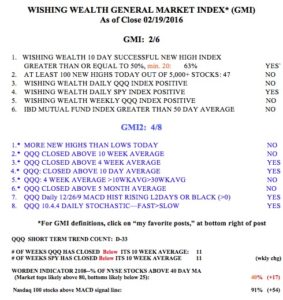
The GMI remains on a Sell signal and I am mainly in cash. Plenty of time to get back in later once the market has turned up. When will that occur and from what level? Nobody knows (but don’t hold your breath)….. For some insight, go to the movies and see The Big Short.