HEIA broke out of a nice base with many other defense stocks. Note above average volume on Wednesday.
Stock Market Technical Indicators & Analysis
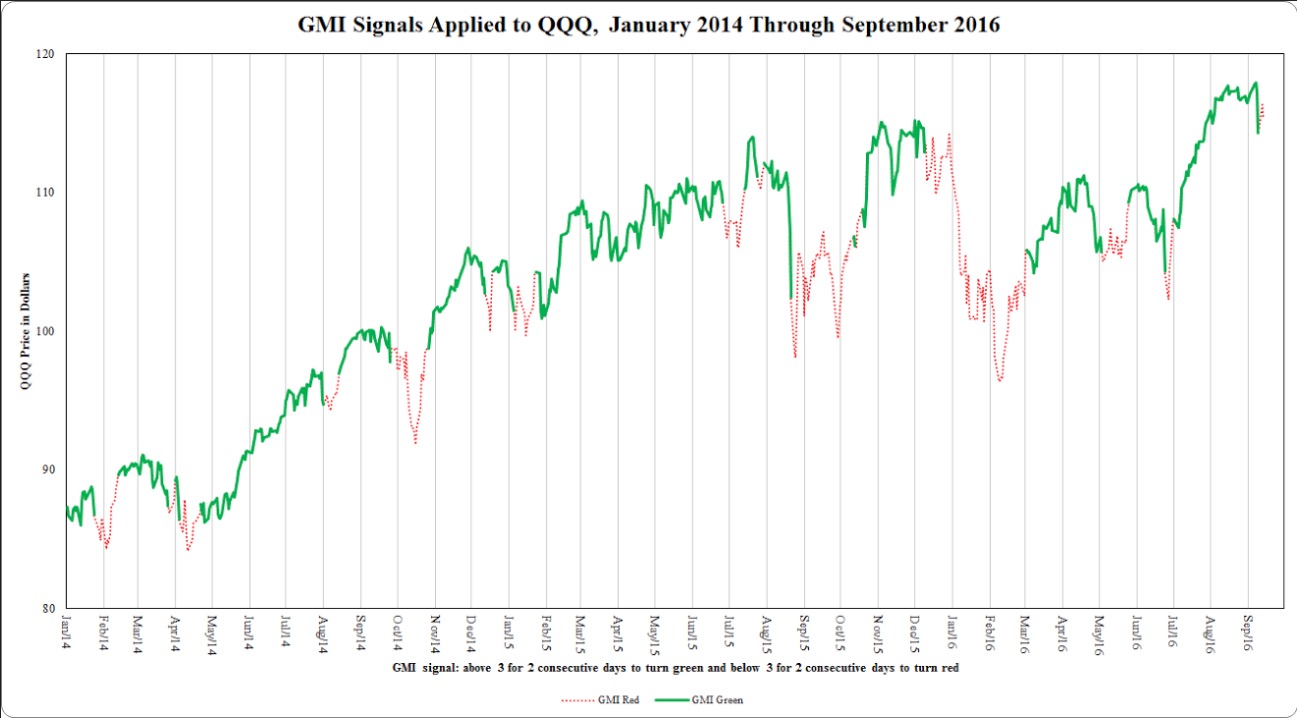
Below is a chart of the GMI signals applied to the QQQ since 2006, when I started it. It has kept me out of the major declines and back in afterwards, although not at the exact bottom. This is a trend following tool. The GMI signals are computed differently than my short term trend count for the QQQ, currently at D-6.
Here is just the past 3 years.

The GMI is currently 1 (of 6) and on a Red signal since October 12. I am very defensive for now. Thank you to my co-instructor, David McCandlish, for creating the charts above.
While the GMI rose to 4, the QQQ may enter a short term down-trend on Friday. Many of the recent leaders have cracked: FB, NVDA, WB. I am preparing to wade into SQQQ if the QQQ is weak on Friday. Interest rates are spiking, as shown by the gap down in the 20+ year treasury bond ETF, TLT, on Thursday.