$QQQ short trend up-trend faces critical test; $NVDA buying climax, short $FB?

GMI3/6
GMI-24/9
T210864%

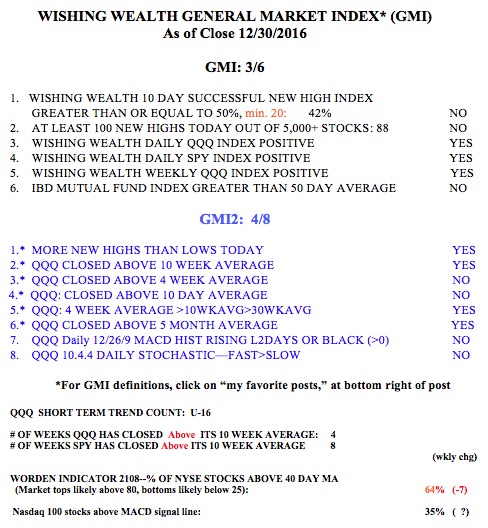
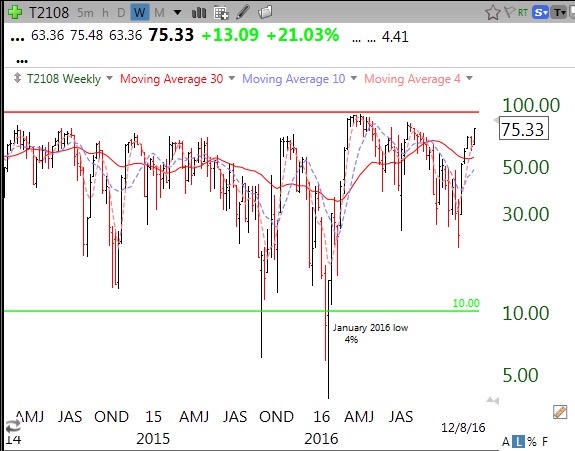
With the GMI weakening to 3 and its short term up-trend in jeopardy, the general market faces a critical test this week. The QQQ short term up-trend has completed day 16 but is on the verge of turning negative.The averages are oversold and today’s futures predict a strong bounce at the open. So the market may move back from the edge of the cliff.

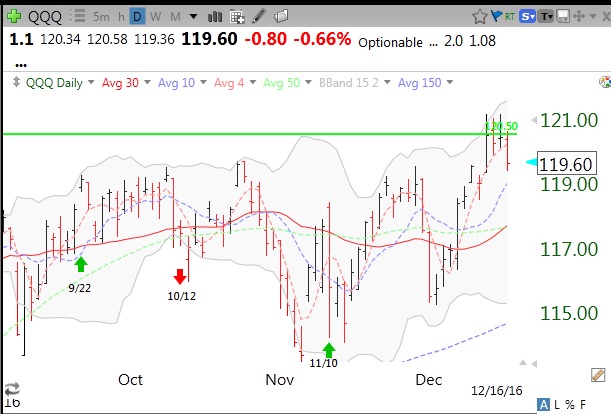
NVDA’s buying climax and reversal last week gives me pause for thought. They generally shoot the leaders first before the rest of the troops. I am also concerned with the weak chart of a former leader, FB. Here is FB’s weekly chart. If I wanted to short a stock this might be a good candidate. Note that FB is below a level (topping?) 30 week average, suggesting a potential Stage IV decline. And there were several weeks of high volume selling in November. Its 4wkavg<10wkavg<30wkavg, a weak pattern. If it pops this week, FB could present a fine set-up for a longer term short with a put option.


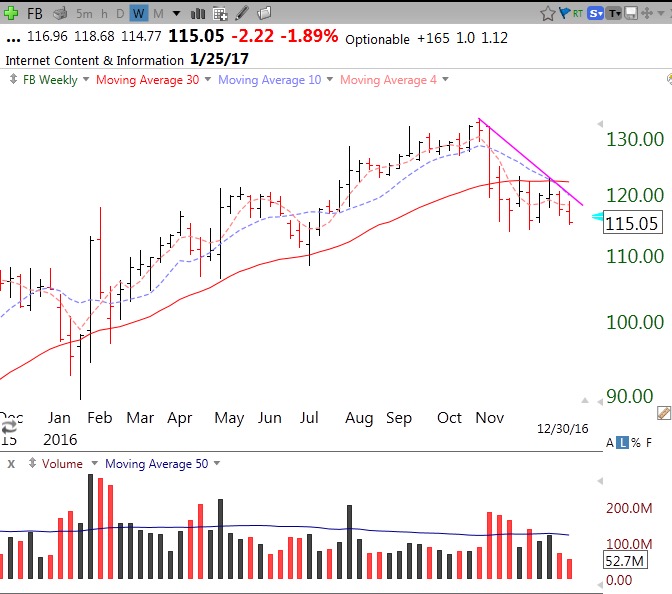
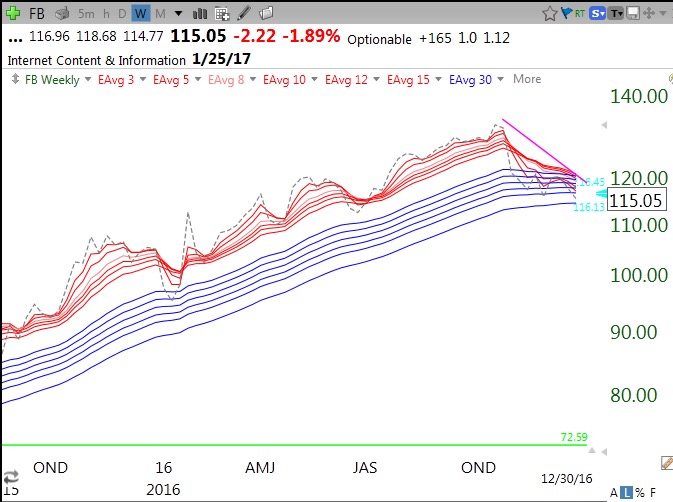
While FB’s RWB pattern is gone, it has not yet formed a BWR submarine pattern and has an RWBCount=6 (of 12). I am watching for a close below the lowest long term (blue) average, currently at 114, to suggest a potential BWR pattern. A close above the top average, at 120.49, would negate this bearish pattern. Note FB reports earnings on 1/25, which could trigger a large move.

The GMI and GMI-2 have weakened but the QQQ short term up-trend count could continue with a significant up day on Monday, with a close above 118.86.  2017 should be an eventful and challenging year for all of us traders–like every year!

Performance of ETFs since GMI turned green on 11/10; $QQQ on verge of GLB

GMI6/6
GMI-27/9
T210870%

As this daily chart of QQQ shows, at the close on 11/10 the GMI turned from Red to Green. The table below shows how stocks and ETFs have done since the close on 11/10 through the close on 12/16.


If one had bought the following index ETFs at the close on 11/10 one would be up these percentages:


The SPY (+3.7%) and DIA (+5.4%) outperformed the QQQ (+3.3%) presumably because the underlying index (NASDAQ 100) contains no financial stocks, which have led the current rally. However, the triple leveraged ETF, TQQQ, as usual, beat all of the regular indexes during this rally, up +10.4%. We again find that that only a few, 10%, of the individual stocks in the QQQ beat TQQQ. In other words, the TQQQ outperformed 90% of the component stocks represented by the QQQ and  83% of those in the DIA and SPY. Yet again, we see how easier it may be to just ride the TQQQ in an up-trend rather than trying to pick in advance the minority of stocks that will beat it. Of course, what goes up 3x as fast also declines 3x as fast…………

The GMI remains at 6 (of 6). Note in the daily chart of the QQQ above, that QQQ is bumping up against its green line, the all-time peak reached in March, 2000. When (not if) it closes above 120.50, it will be a green line break-out (GLB), and only positive for me as long as it stays above the green line.

New $QQQ short term up-trend; T2108 becoming extreme

GMI6/6
GMI-28/9
T210875%

All of my GMI and GMI-2 indicators are positive and the QQQ short term trend is now up. The QQQ short term trends have been going back and forth between up and down very quickly. But the longer term trend measured by the GMI has been Green since November 10. One note of caution is the high value of T2108. This pendulum of the market goes from overbought to oversold. (T2108 measures the percentage of all NYSE stocks that closed above their 40 day moving average of price.) Now at 75%, the T2108 is at the highest level since last July, five weeks before the SPY topped out. See the weekly chart of T2108 below. T2108 is entering nosebleed territory.