The GMI rose to 2, and I am nibbling at tech stocks and QLD. 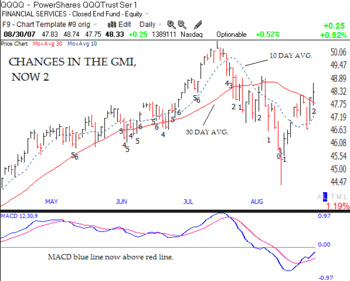 The QQQQ is now above its 30 day (red), 10 day (dotted line) and 10 week averages, a very good sign. The daily MACD (blue) is also above its signal line (red). The Daily and Weekly QQQQ indexes are now positive. The QQQQ is also stronger than the other indexes I follow: SPY, DIA and IJR. I am beginning to write covered calls on strong IBD 100 stocks. Still, there were only 37 new highs and 28 new lows in my universe of 4,000 stocks on Thursday. Small bets are best for now, until the GMI rises to 4.
IBD
GMI:1; Turn coming?
The GMI is still at 1, but with 2 indicators very close to turning positive, signified by a "?." One more day with the QQQQ or DIA closing higher than they closed on Friday will turn their respective daily indicators positive. That would get the GMI to 3, and 100 or more new highs on Monday would get it to 4. Even the IBD Growth Mutual Fund Index is within striking distance of turning positive.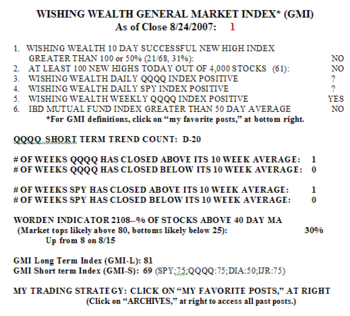
I know I have said that its is bad to anticipate market moves. But typically, when my gut says that a particular move is impossible, it is time to begin considering that that move may take place. It seems impossible to think that the market will turn and move on to new highs right away. And yet, that is what might occur. First of all, too many pundits are skeptical of this rally. Second, the investment newsletter sentiment is now 40% bullish and 37% bearish. The bearish percentage has doubled from its recent lows and is usually a great contrary indicator. Third, the Worden T2108 indicator (% of New York stocks above their 40 day averages) signaled a bottom around 8% and is now back to 30%. This market pendulum is moving back towards bullish and will top out typically around 80%. Fourth, I have learned I should not fight the Fed–it always prevails. And finally, the QQQQ and SPY ETF’s are now above their 10 week averages. I have the greatest success being long when the QQQQ is above its 10 week average.
So, when I look over this landscape, it suggests to me that the worst may be over and that I should close out my short position and look for a opportunities to go long. If Monday’s market moves up, I may begin to phase into QLD. Also, a lot of growth stocks are rebounding, including GRMN, CMG and AAPL. I may write some September covered calls if the GMI increases to 4.
GMI: 1; More new highs than lows; Performance of GMI; Strongest IBD100 stocks
The GMI moved up one, as the QQQQ Weekly Index turned "bearly" positive. For the first time since July 23, there were more new highs than lows in my universe of 4,000 stocks (61 vs. 46), a promising sign. 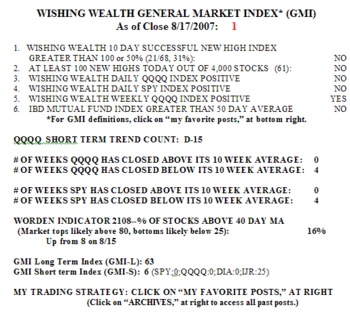 The Worden T2108 count of the percentage of all NYSE stocks closing above their 40 day averages has now rebounded from an extreme low reading of 8% to 16%. Finally, the SPY and DIA have now closed below their 10 week averages for 4 consecutive weeks. I have written before that I am much more successful buying growth stocks when the QQQQ is above its 10 week average. Only one of the 16 short term indicators for the IJR, DIA, SPY and QQQQ is positive (GMI-S: 6%) . Friday was the 15th day in the current QQQQ short term down-trend.
A reader asked me to post a chart of the recent performance of the GMI. There is no magic to the GMI. It is merely a count of the six market characteristics that I find useful for tracking the current trend. These indicators have helped me to survive in the market and have kept me out of all major market declines since 1994. 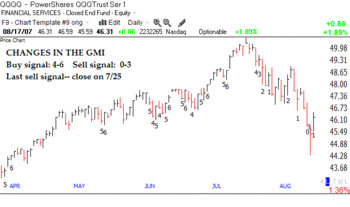 Remember that I am a chicken. I have no problem going entirely into cash and waiting for the storm clouds to clear. I typically start to exit the long side of the market when the GMI falls below 4 and to buy once it climbs back above 3. I refuse to own stocks when the GMI is low. I do not fight the tide. The GMI measures only the behavior of the markets and not what people think or hope will happen. At the close of the day of the sudden drop in February, the GMI registered 1 (down from 6) and stayed below 4 until March 21. From March 21 through July 24, the GMI registered between 4-6, but mostly 5 or 6. During this period the market rose about 11% and I had much success trading on the long side and writing covered calls. The GMI fell to 3 at the close on July 25th and has been below 4 since then. So, I have escaped the latest carnage……
The great trader, Jesse Livermore, refused to label a market bear or bull. He said that these terms have too much baggage regarding longevity and size of a move. He asserted that he could only characterize the current trend of the market. I agree with Jesse’s opinion. The market appears to me to be in a down-trend and it remains so until the GMI rises to 4. I understand how difficult it is for people to refrain from buying or holding stocks even when the odds are against them. It took me a very long time to learn to respect the trend of the market and not to fight it. (I used to profit in the up-trend and give it all back and more in the subsequent decline.) This is THE KEY to successful trading…..
While this is not the time for me to buy stocks, I find that declines offer the best opportunity to find the next winners. The few stocks that can resist the market decline tend to become stars. While 80% of the 440 IBD100 stocks I monitor have declined since July 19, the following are the ten biggest gainers: ISRG +33%, HMSY +32%, MORN +26%, ANSS +24%, BLUD +22%, GMCR +21%, RADS +20%, FSTR +19%, NVT +18% and SMDI +18%. Some of these may be among the best stocks for me to focus on when the market turns…..
