GMI: +6, ETF winners and losers; Interest rates

To my visitors: I am only one trader, not a guru, and not a financial advisor.  I am presenting my own opinions and my own experiences and people are welcome to decide for themselves what, if anything, on this site is of value to them.  Please refer to the additional comments, highlighted in red, at the end of this post.

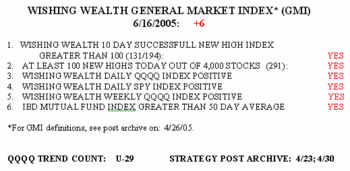
The GMI remains at +6 and the tech stocks continue to lead this rally.Gmi616 There were 291 new highs today in my universe of 4,000 stocks and only 12 new lows.  This is the greatest ratio of new highs to new lows since I posted the GMI on April 26.  By the way, a number of you have asked me how I compute the GMI–just check out my post in the archive on 4/26.  68% of the Nasdaq 100 stocks rose today, 69% of the S&P 500 stocks and 57% of the Dow 30.  This is turning into a respectable rally, having lasted for 29 days (U-29).
I thought you might like to see what ETF’s (exchange traded funds)have performed best in this period.  So, I used TC2005 to run a scan of ETF’s when the QQQQ advanced 5.2%.  The winners are OIH (+10.5%, oil service); EWW (+9.5%, Mexico stocks); IGW (+9%, semiconductors); IYE (+8.8%, energy); PWT and XLE (+8.6%, energy) and IIH (+8.5%, internet).  Clearly the oil and energy sectors were the place to be.  Will they continue to lead this rally? 

The biggest losers include EZA (-5%, South Africa); BHH (-4.5%, B2B internet); EWK (-2.8% Belgium) and EWJ (-1.6%, Japan). Other more traditional sector ETF’s that were weak include PPH, IXP, XLP and XLV. PPH (-1%) includes all of those wonderful pharmaceutical stocks (LLY, BMY, JNJ, WYE, SGP, MRK, VRX—these stocks declined 2.3-13.6% in this period) that the pundits have been recommending  to conservative investors in difficult times (like these??) I told you weeks ago that JNJ looked sick.

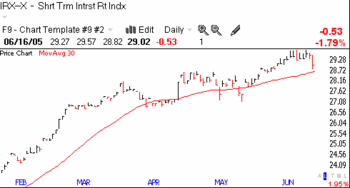
By the way, the short term interest rate index I have been monitoringIrx616 cracked today. Speculators are betting less on interest rate hikes, at least today they did. (Click on chart to enlarge.)
Send your feedback and questions to: silentknight@wishingwealthblog.com.

Please remember that the stock market is a risky place, especially now.  I am not providing recommendations for you to follow.  My goal is to share tools and methods that I have used over the past 40 years of trading, so that you may learn from them and adapt them to your trading style and needs.  While I do my best, I do not guarantee the accuracy of any statistics computed or any resources linked to my blog.  Please consult with your financial adviser and a mental health practitioner before you enter the stock market,  and please do not take unaffordable risks in the current market environment.  See the About section for more statements designed to protect you (and me) as you navigate this market. Past performance does not guarantee future results, but I would rather learn from a former winner than a loser.
QQQQ bounced; GMI: +6; Some gappers; Favorite books

To my visitors: I am only one trader, not a guru, and not a financial advisor.  I am presenting my own opinions and my own experiences and people are welcome to decide for themselves what, if anything, on this site is of value to them.  Please refer to the additional comments, highlighted in red, at the end of this post.

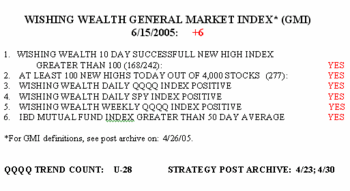
The QQQQ successfully tested its up trend today, bouncing right at support. Gmi615 The coast looks clear to me–I added to my position of QQQQ shares today.  The GMI remains at +6; there were 277 new highs, the largest number in weeks, and only 13 new lows in my universe of 4,000 stocks.  Between 53% and 59% of stocks in the Nasdaq 100, S&P 500, and Dow 30 indexes closed higher today.  Today marks the 28th day in the QQQQ up trend (U-28).  We may be setting up for the end of month/quarter rally I have been anticipating.

Among the stocks that gapped up out of bases on high volume today are:  PGIC, SKX, ARB, FLIR, EBF, PSYS, WCI, and IIIN.  Check them out and, especially, see if news was released that could affect the continuation of the rise.  Good luck!

I added to the side bar (at the right) a list of my favorite stock trading books.  Hope you enjoy them too.

Send your feedback and questions to: silentknight@wishingwealthblog.com.

Please remember that the stock market is a risky place, especially now.  I am not providing recommendations for you to follow.  My goal is to share tools and methods that I have used over the past 40 years of trading, so that you may learn from them and adapt them to your trading style and needs.  While I do my best, I do not guarantee the accuracy of any statistics computed or any resources linked to my blog.  Please consult with your financial adviser and a mental health practitioner before you enter the stock market,  and please do not take unaffordable risks in the current market environment.  See the About section for more statements designed to protect you (and me) as you navigate this market. Past performance does not guarantee future results, but I would rather learn from a former winner than a loser.
GMI at the max: +6; Buying Gaps; GM, HANS

To my visitors: I am only one trader, not a guru, and not a financial advisor.  I am presenting my own opinions and my own experiences and people are welcome to decide for themselves what, if anything, on this site is of value to them.  Please refer to the additional comments, highlighted in red, at the end of this post.

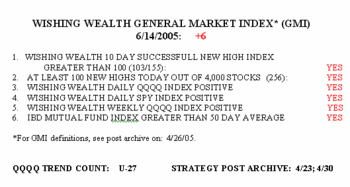
The GMI is back at +6 with the QQQQ weekly index turning positive.  Gmi614_1 There were 256 new 52 week highs in my universe of 4,000 stocks, highest in more than 2 weeks.  There were only 15 new lows.  The Nasdaq 100 stocks were less strong than the other indexes; 48% of those stocks rose, compared to 63% of the S&P 500 stocks and 67% of the Dow 30.   Today is the 27th day of the up trend (U-27).

Since the beginning of the up trend on May 6, the QQQQ has risen 4.8% and 75% of the Nasdaq 100 stocks have increased.  (This is an example of the wishdom of the saying that about 70% of stocks follow the general market averages, and is another reminder of why it is most profitable to follow the market trend.) Among the Nasdaq 100 stocks that rose, the median increase was about 8.5%, meaning that half of the gainers rose more than this amount.  The largest gainers were LVLT (+37%), SANM (+27%), CECO (+27%), FLEX (15%), NXTL (+16%), MRVL (+16%) and KLAC (+15%). The largest decliners were ATYT (-15%), SSCC (-15%), SEBL (-10%) and BIIB (-9%).  I hope you were long some of the winners and none of the losers…………………………….

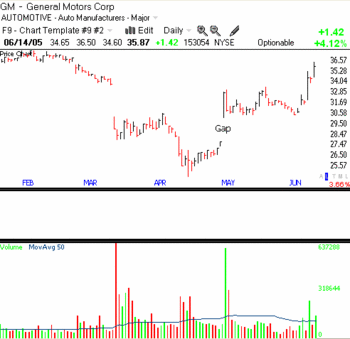
Several stocks gapped up today (the low today was greater than the high yesterday).  Some that may present interesting possibilities include POT, SMTS, DIOD and CNS.  All have interesting technical pictures and fundamentals.  Check them out.  A gap up means that the demand for the stock temporarily overcame the supply of the stock.  It often times portends a strong up trend as long as the stock stays above the gap. The volume on the day of the gap should be way above its average volume, demonstrating unusual demand.Gm  Here is a timely example of what I mean. On May 4, GM gapped up and closed at 32.80 up 5.03.  Look at the extreme volume of shares traded that day.  The low for the day was 30.11.  My strategy is to buy the stock that day or the next and place my sell stop below the low of the day it gapped, here about 30.  Note that the volume died down as GM consolidated, but the stock never traded near 30.  Its low point was 30.40 during the next three weeks, comfortably above the stop loss point.  Then, like clockwork, GM finished consolidating and broke up on increased volume again.  I noticed this formation in GM but did not buy it.  I prefer stocks near new highs, not at new lows.  Still, there are many, often antithetical ways, to profit from the market.

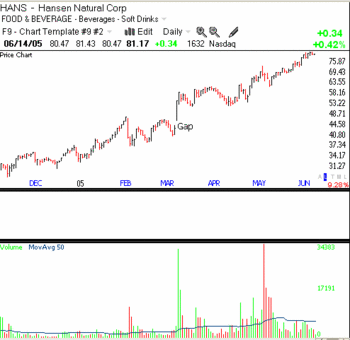
Here is another example of a gap up, this time in a powerful stock, HANS.  Hans On March 15, HANS gapped up to close at 54.57, up 11.31 for the day.  The volume was many times its 50 day average of daily volume.  The stock never traded back to that day’s low of 46.13, and closed today at 81.17.  The strategy of buying the stock on the gap and placing a sell stop below the low of the day would have worked beautifully here.

These are just 2 examples of how a high volume gap up day can signal the potential for future gains.  By pursuing a conservative strategy of making a small pilot buy into such strength, coupled with a stop loss at the gap day’s low it may be possible to hitch a ride on a  rocket for a long, profitable ride up, while risking a small manageable loss.  Of course, as I have been saying all along, this strategy and other purchase strategies have the best chance of working in a market that is trending up–like now. (How do I find high volume gaps?  I use TC2005.)

Send your feedback to silentknight@wishingwealthblog.com.

Please remember that the stock market is a risky place, especially now.  I am not providing recommendations for you to follow.  My goal is to share tools and methods that I have used over the past 40 years of trading, so that you may learn from them and adapt them to your trading style and needs.  While I do my best, I do not guarantee the accuracy of any statistics computed or any resources linked to my blog.  Please consult with your financial adviser and a mental health practitioner before you enter the stock market,  and please do not take unaffordable risks in the current market environment.  See the About section for more statements designed to protect you (and me) as you navigate this market. Past performance does not guarantee future results, but I would rather learn from a former winner than a loser.