Well, the indexes again bounced off of their lower Bollinger bands and the market’s short term up-trend resumed. Note the 5th bounce that I just added in red to the chart I posted on 10/19 after four bounces. 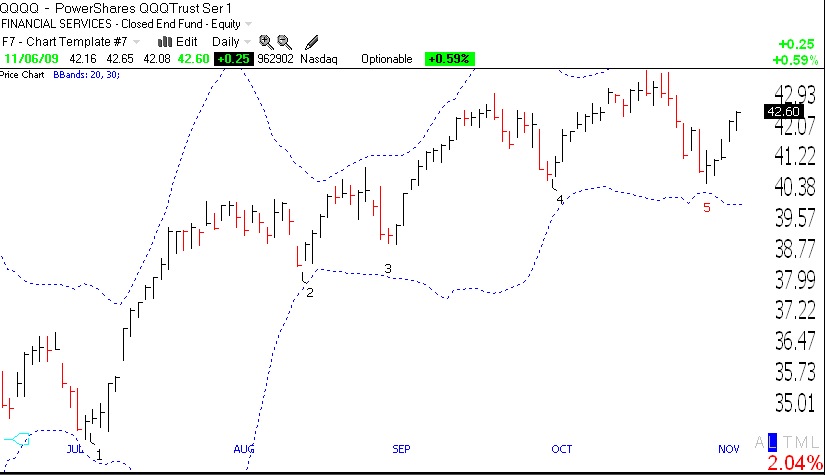 Review that post if you want to understand the logic of Bollinger bands. If only I had the patience to wait for the bounce to enter my long positions! Maybe next time. The QQQQ is even back above its 10 week average! So, as much as I hate being whipsawed by the recent decline, if I flew solely by instrument, I would have to be long again. But watch out for a possible right shoulder forming in a head and shoulder pattern. If the QQQQ falters before it surpasses the peak reached on 10/21, we could see a large drop, especially if QQQQ closes below the neckline, around 40.6 . So, if I go long, I will place some close sell stops and monitor QQQQ’s progress very carefully. Meanwhile, the GMI is
back to 5 (of 6) and the more sensitive GMI-R is back to 9 (of 10). 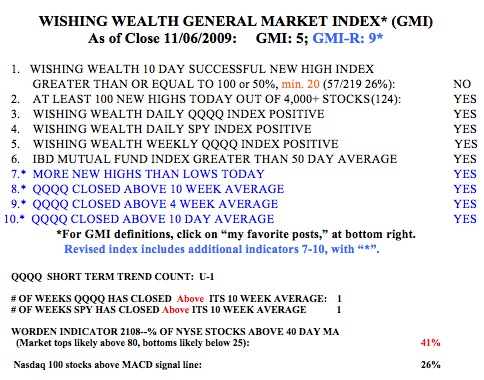 With the short and long term trends back in synch, I feel more comfortable holding some long positions now. The T2108 is back to 41%, well out of oversold territory. And 26% of the Nasdaq 100 stocks have a MACD above their signal line, up from just 9% on October 30. So, tech stocks are gaining strength again….
I have been watching gold very closely, as the dollar has been in a consistent down-trend. When I trade gold, I use the gold ETF, GLD. It reflects the price of gold directly and I prefer to trade it rather than gold mining stocks. For those looking for an ultra (2X) long gold ETF, there is also DGP (DZZ is the double short version). What impresses me so much about gold is the monthly chart of GLD below. One can clearly see periods of multi-month up-trends followed by consolidation periods. 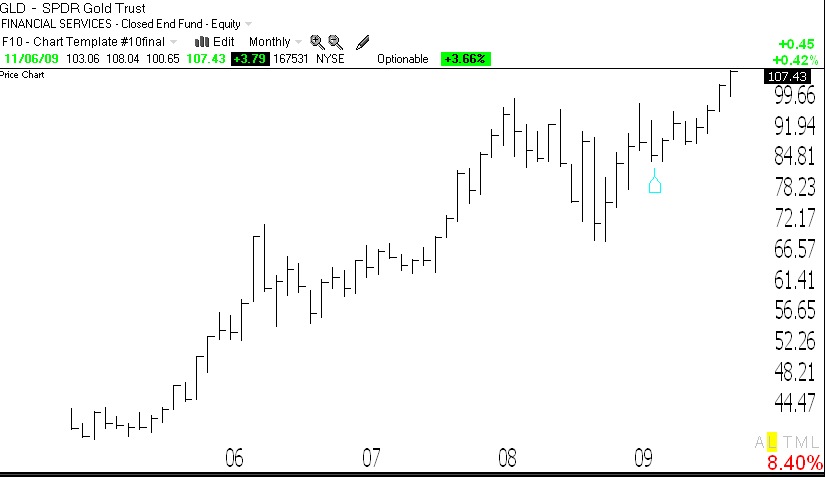 Note the 7 month rise in 05/06, followed by a 15 month consolidation, and another rise of 7 months followed by a 17 month consolidation. We now have a new break out, currently in its second month. Given the long consolidation that it has just broken out of, I suspect that gold has several more months of an up-trend remaining……..
On October 5th, with STEC around $27, I wrote that I thought its nice up-trend had ended. Last Friday, STEC closed around $13.
I am in a new position at work requiring rapid decision making and managing people. The side effect is it’s helped significantly in my investing. Buying and selling decisions now come more easily. I previously thought too much.
Something I’ve tried lately with success is buying inverse ETFs when my short term indicators show weakness. I don’t like being cycled through my holdings, and I don’t like being stuck with the 4-8% or so hit while I wait for the market to show itself. At least I’ve been market neutral during a correction.
Wow, the market has been down then up in these past few weeks. Thanks for the post. It’s especially helpful when you make a post on the 1st day a new short term uptrend or downtrend.