Julia Ormond, who hosted my webinar, will be presenting a free training class on the Worden software in Bethesda on May 7th and 8th. I always learn something from her excellent workshops. I plan to attend the Saturday workshop–look for me if you can make it. You can register at the Worden site.
Month: April 2010
Webinar is archived and available; Get a copy of my TC2007 scan
The response to my webinar with Julia Ormond, of Worden, was very gratifying. I described a scan that I use to find a stock rebounding from an oversold condition. It employs an oversold stochastic together with a bounce from, or break out above the 30 day moving average. If you would like a copy of the scan I demonstrated, simply click here for the PDF.
Come to my free Worden webinar presentation this Tuesday evening
The people who developed the TC2007, FreeStockCharts.com, and StockFinder charting and technical analysis software have invited me to give a webinar on technical analysis this Tuesday evening at 8:00 PM. I plan to talk about the GMI and a scan I use to find and time good buy candidates. The webinar is free and you will have an opportunity to ask me questions. To register, please go to the Worden site, www.worden.com. I am pleased to do this for them because I rely on TC2007 for my own trading (I am Sir Silent Knight) and use it extensively with my university classes, with strong support from Worden staff. It is very gratifying to see my students learn how to use their incredible scanning and charting tools to look for stocks. I hope to see you there…..
Meanwhile, my GMI (General Market Index) and GMI-R (revised) remain at their maximum values (click on table to enlarge). In preparing for the webinar, I looked back at the performance of these market indicators over the recent past. As most of my readers already know, the GMI got me (and I hope others) safely out of the 2008 bear market near its inception. On September 2, 2008, at the beginning of the steep drop in the QQQQ, the GMI went from 3 to 1 and remained at mainly 0 until December 30. I tend to get defensive when the GMI is less than 3. During that steep decline, the QQQQ fell 35%. During the next 8 days the market rebounded and the GMI registered 3. But on January 12, 2009,the decline resumed and the GMI stayed below 3 again (mainly 0) until March 23, when the market successfully retested its bottom. Since the bottom, with the exception of 7 days in July and 17 days during the decline at the end of January and early February, 2010, the GMI has been 3 or higher. In fact, since February 23rd, the GMI has been 6, helping to keep me in this market. While not perfect, the GMI has kept me out of the market in down-trends and got me back in during up-trends. (Of course, past performance does not guarantee future success.)
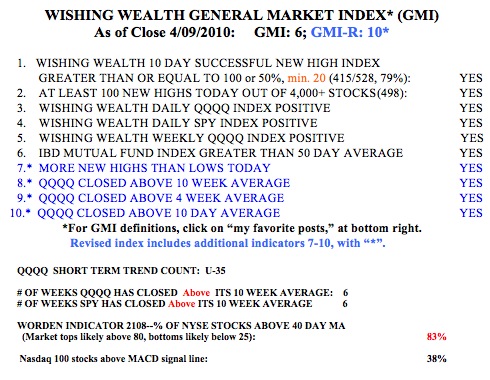
So, the QQQQ and SPY index ETF’s have closed above their 10 week averages for six weeks now. When these indexes are above their 10 week averages I usually can trade growth stocks (on the long side) profitably. The Worden T2108 Indicator is 83%, in overbought territory, but below the extreme levels (around 90%) often seen at market tops. T2108 measures the percentage of NYSE stocks that closed above their 40 day simple moving average. You can get a chart of T2108 in the Worden software packages and see for yourself how this indicator has behaved at market tops and bottoms since 1986.