This is one of those up-trends that everyone loves to hate. But the train has left the station. I am still without power at home after the flash storm on Sunday. When things get back to normal I will post the results of scans for stocks that meet my buying criteria.
Month: July 2010
GMI: 5; T2108: 78%; Looking to go long
I was prevented from completing my blog post this weekend because we lost power during the storm Sunday afternoon. I still lack power, and will do a full post when it returns and I can get on my home computer.
The only indicator still negative is the QQQQ Weekly Indicator, which means the longer term trend remains flat or down. We are close to a turn, however, and then the GMI would equal 6. There were 178 new 52 week highs on Friday in my universe of 4,000 stocks. I will look for buys among these stocks which held up during the recent market turbulence.
One negative, with the T2108 at 78%, it is getting near the level where markets have topped. I always wade into the market slowly when I think the market trend is turning.
GMI: 4; Turn coming?
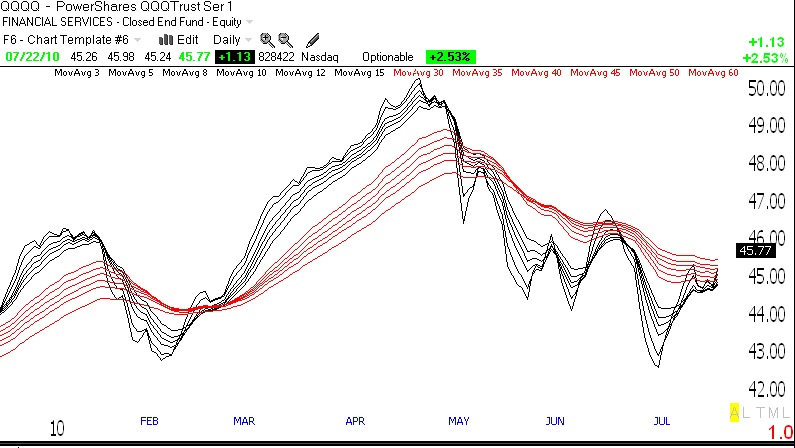
The indexes are very close to breaking above their key longer term moving averages. There were 134 new 52 week highs and only 17 new lows in my universe of 4,000 stocks on Thursday. The Worden T2108 Indicator is now at 70%, almost in overbought territory. The GMI is at 4. The IBD Mutual Fund Index is now above its 50 day average, which is still declining. The key is not to jump the gun but to wait for a definite signal of a longer term up-trend. The GMMA daily chart of the QQQQ (click on chart to enlarge) shows that the short term averages (black) are climbing up through the longer term averages (red)–but they are not there yet!