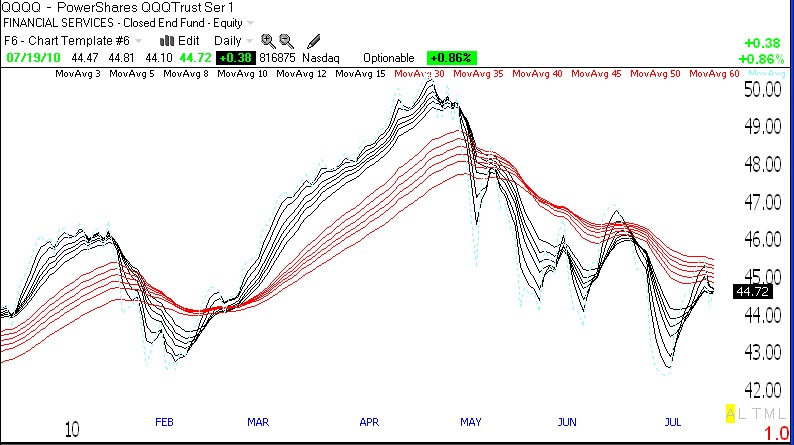
For the first time since June 21, there were more than 100 (104) new 52 week highs in my universe of 4,000 stocks. In addition, 73% of the stocks that hit a new high 10 days ago closed higher on Tuesday than they did 10 days before, showing strength in stocks hitting new highs. While the GMI rose to 3 (of 6) all 4 of the more sensitive indicators in the GMI-R are now positive, yielding a GMI-R of 7 (of 10). The Worden T2108 Indicator is at 60%, indicative of a rising, but not overbought, market. And the QQQQ closed slightly above its 10 week average, breaking a run of 11 weeks below that critical level. What is the major negative? The 10 and 30 week averages are still in down-trends, reflecting a potentially serious down-trend.
Given these conflicting signals, it is time for me to move my stops very close on my short positions and to remain mostly in cash. It remains to be seen if the indexes can hold on to these critical short term technical levels through the close on Wednesday. If they can, I will slowly wade back into the market on the long side. It is critical not to marry a particular market scenario and to be ready to adjust quickly to a significant change in trend.
By the way, my very wise stock picker friend, Judy, took small long positions in APKT and ARMH on Tuesday. Judy buys stocks based on the concept behind the business and her own technical analysis methods and frequently buys a stock before my technical indicators signal a buy.