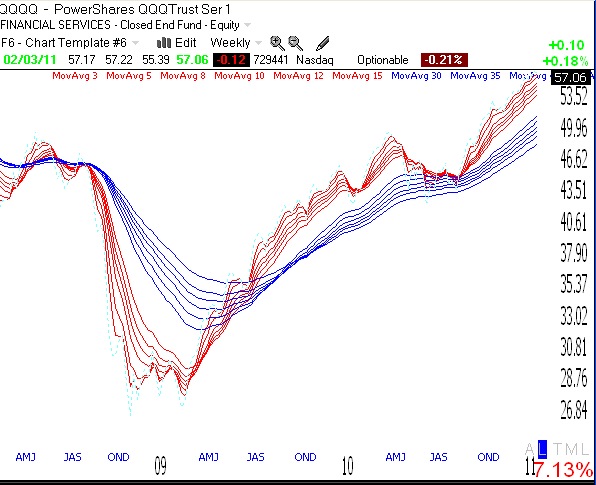
I often show you the RWB rocket pattern as it applies to individual stocks. It is the pattern of stocks in strong up-trends. The Red, White and Blue pattern is evident in a weekly GMMA chart where all of the short term averages (red lines) are well above their rising longer term averages (blue lines) such that there is a white band between them. It is noteworthy to me that the Nasdaq 100 index shows this powerful pattern. (Click on chart to enlarge.)
It may make sense to own some of this index by buying any of the bull ETF’s or ultra ETF’s that track it: QQQQ, QLD, TQQQ. I usually wade into these in stages with each purchase having to be higher than the previous one. I never add to a long position that is moving down–I always average up.
I have shown in prior posts that the ultra (2x or 3x) ETF’s often beat most individual stocks in an up-trend. For example, since November 30, the QQQQ has advanced +9.5%, QLD +19.9% and TQQQQ +30.8%. In comparison, during the same time period only 3% of the Nasdaq 100 component stocks have advanced 30% or more and 17% advanced 20% or more. We see, again, that buying the ultra QQQQ ETF’s would have outperformed most individual stocks in that index.
It is even better than that, however. During this period only 5% of the S&P500 stocks rose 30% or more and only 20% rose 20% or more. So the ultra QQQQ ETF’s outperformed most of the S&P500 stocks too. Why search for the small minority of individual stocks that will outperform the ultra ETF’s when one can just ride one of these ultra long ETF’s during a strong (RWB) up-trend.
Hey H,
Go to the CME website. It has all the info on futures.
Or you can just google “futures” or some variation of the term.
As far as data,your futures brokers will provide free data so you can plot various timeframes. Godd luck. Rok