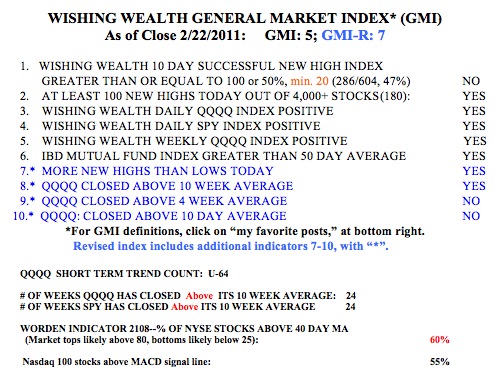
I did not post Friday’s stats because the market was closed on Monday. So, today I publish the full General Market Index (GMI) table, that I usually post on Monday morning. The one statistic I want to mention from Friday, was the the Worden T2108 Indicator, which reached 75% on Friday. That means that 75% of the NYSE stocks closed above their 40 day moving average. The T2108 indicator acts like a pendulum of the market. Up-trends tend to end near 80% and down-trends below 20%. With Tuesday’s decline, the T2108 moved down to 60%, in neutral territory. One can get a chart of T2108 by signing onto the the free chart service, freestockcharts.com and entering the symbol, T2108. This service is a good free charting service that can be used for doing technical analysis of stocks, ETF‘s, and mutual funds.
Because many new readers may be coming from the UMD Stock Challenge, I have created the UMDSMC category for all posts that have additional educational content. You can get a description of the GMI components by going to the Favorites section to the right of this page. Most people who have made a lot of money in the stock market talk about the importance of the general market’s trend to their success. The idea is that most stocks follow the trend of the general market. So, if one can figure out the trend, one can be sure to buy or sell consistent with it. My GMI indicator counts a number of short and long term indicators of the trend of the market. I focus largely on growth technology stocks, as reflected in the Nasdaq 100 Index. This index can be bought or sold by using a number of ETF’s (exchange traded funds). So, I follow the QQQQ (Nasdaq 100) and SPY (S&P500) and DIA (Dow 30 Industrials) ETF’s. You can look at this post to see how the GMI kept me out of the market during the big decline in 2008. I teach my students that it is possible to time the market and they should not ride a significant down-trend. Better to get out of a significant decline and to buy back in after it ends. (One can keep dollar cost averaging into diversified mutual funds all through the decline, though, because they tend to come back with the market.)
The GMI declined on Tuesday to 5, and the more sensitive GMI-R declined to 7. The long and short term market trends I follow are still up, but the short term trend would turn down if the QQQQ does not advance on Wednesday. 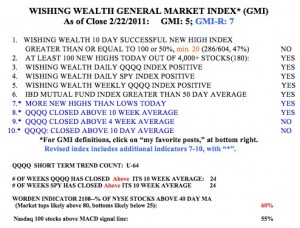 Last Friday was the 64th day of the current short term QQQQ up-trend. Note that the SPY and QQQQ have closed above their 10 week averages for 24 weeks. This has been a long advance. I tend to become cautious when the market indexes close below their 10 week averages or when the GMI declines to 3 or less. I also become concerned when the market leaders, like GOOG, AAPL, NFLX, weaken, as is now the case.
Remember, one can always get out of a position and re-enter it if the stock shows your buy signal. In simulated trading and when trading in a tax deferred account, one does not have to worry about tax consequences or wash sales rules.
Bottom line is that I am watching the short term trend of the QQQQ. If it turns down, I will not buy new stocks and will monitor my short term holdings for exits. The key to success in the stock market is to have a lot of little losses and a few very large gains.