Once a decline begins, no one, including all of the media pundits, can accurately predict the bottom. It is up to every person to determine his/her acceptable level of risk. Contrary to the prevailing media wisdom, one does not have to stay in the market all of the time. One can get out and wait for an up-trend to emerge. The often cited studies that say that one ‘s portfolio underperformed if s/he were out of the market during the days with the largest gains fail to note that one did the best if s/he was out of the market during the days with the worst declines!
I think it is possible to time the market. People also say that once you get out you will miss the bottom and some of the subsequent rise. Hogwash! If I get out of a mutual fund at say, 80, and it falls to 60, as long as I get back in before it goes back above 80, I have managed the risk and done well. And maybe I will get back in around 70 and come out way ahead. I have not exited my university pension mutual funds because of their unacceptable rules against market timing. However, if I were in mtual funds or better still, exchange traded funds which I could trade at will, I would have taken some money off of the table by now.
The technicals are terrible, as reflected in the GMI and GMI2 both registering zero. My trading account doubled since I went back into the market last September at the beginning of the multi-month rally. On September 7, the GMI reached 5 and began a long stream of 5’s and 6’s. Think how well I could do if I only stayed in the market when the GMI was strong! So, I did give up some of my gains as the GMI weakened, but my trading account is still up about 70% since last September. My trading gurus, Darvas and Livermore, used to say that no one forced a person to be in the market and one should only go in when the conditions look favorable. And they couldn’t look much worse right now.
The GMI and GMI2 are both zero out of 6. All of my short and long term indicators are negative. I do not try to interpret how political and economic events might affect the market. 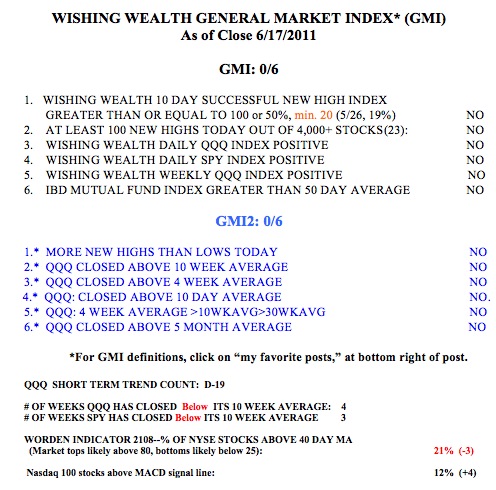 If the reasons for the market’s movements typically become evident after the move, it makes sense to focus on the movement of the market and to not attempt to read the tea leaves. So, almost all of my indicators are designed to discern the current trend of the market. Once I know that, the correct strategy becomes clear to me. The QQQ short term down-trend has now lasted 19 days, but we had a 29 day decline in June, 2010, and a 69 day decline in December, 2008. If we are at D-19 now, it could continue for a while.
However, I do have an indicator that gives me some idea of how oversold the QQQ is now, relative to other recent declines. The chart below of the weekly 10.4.4 stochastic suggests to me that the current decline is approaching the severely oversold levels seen at other recent market bottoms, even during the 2008 debacle. Note that the fast stochastic line (black) in the bottom panel is almost below the horizontal line designating 20%.(Click on chart to enlarge.) However, other big declines ended below the 20% level. So, we may have more to go on the downside. But for me, this is not the time to begin to go short. Then again, no one knows for sure. 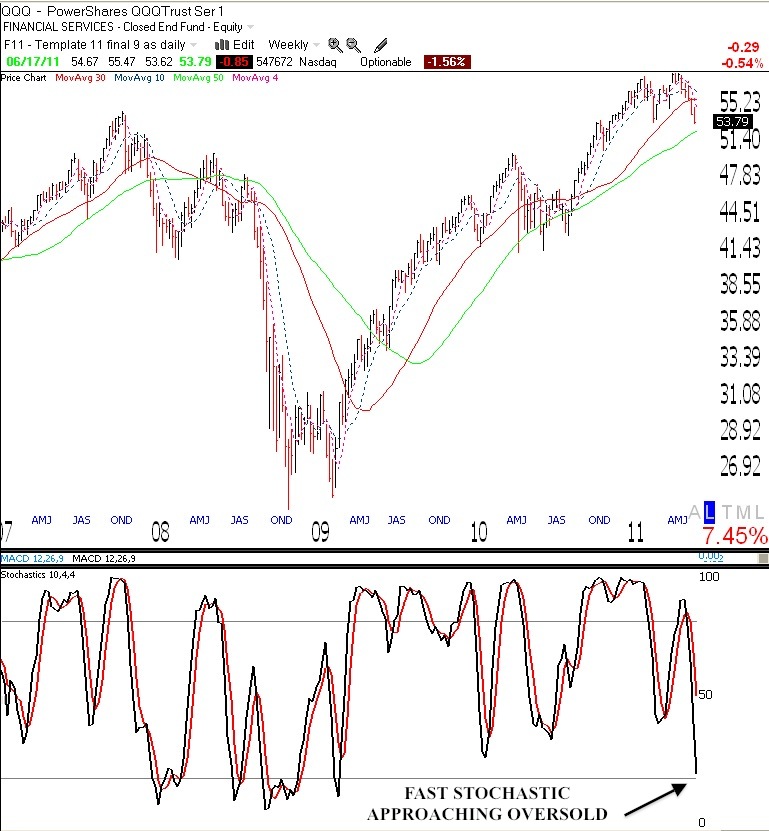
AAPL MA crossed over for the first time in the cycle.
Ye,gloom and doom infidels!! Me,I have been doing well with my LULU, which I’ve mentioned here a few times, where I am fully invested all my trading money. I plan to sell it around $100. Praise the Lord!!
dear dr; i once wrote to you about worden’s but alas, did not receive an answer. it felt bad but i endured. still do not see why you think it’s good.
concerning the stochastic comment above.it would help to know which cycle do you use between the bottoms. george lane and his disciple constance brown, aligned this indicator to a cycle. to do this they used an erlich cycle finder or counted how many bars in this case weekly bars it took for each cycle to complete. then they looked at the stochastc levels. in their view once stochastics reached that magic 20 ans below level. only half the journey had been accomplished. the move had more to go. then they used elliott and or othe methods to estimate a target. like you i’ve noticed stoch has reached this magic lower level where some bounces have occured. however, on the same chart i see a low in 09, followed by a small bounce and another low, a double bottom. and still another low. making the bounce in between a potential trap. i believe that there must be a setting (cycles and stochhastic) which would more closely resemble the action of the market.to me the above chart does not do it. no criticism only a question. lastly, why do you use the 10,4, 4 setting. in lane’s lectures he emphasises that he would set stochastics at half the value of the cycles depicted in the chart. just trying to understand. btw, i’ve found stochastics to be a very valuable tool. if combined unfortunately,with other more complicated tools. imho. thanks
LEON, the past is not the key to the future!
Dr. Wish, I continue with my LULU (paid $65) still going up to $100 when I will sell. La vita e’ bella!