GMI falls to 3; T2108 drops; post-earnings lull; natural gas is turning

GMI3/6
GMI-23/9
T210849%

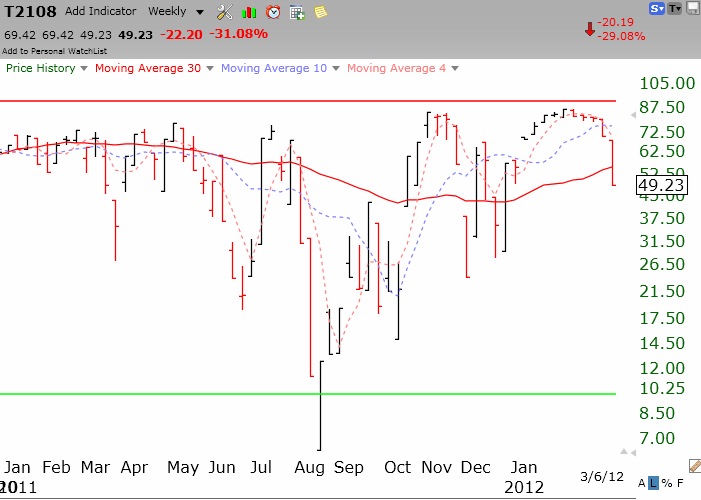
As this weekly chart shows, the T2108 has continued the decline that began 4 weeks ago.   As of Tuesday’s close, 49% of NYSE stocks closed above their 40 day average price. Declines usually end when this indicator falls below 35%. This is the post earnings release lull we expected.   I expect a bounce at the end of the month and a rise when earnings are released again in mid April.

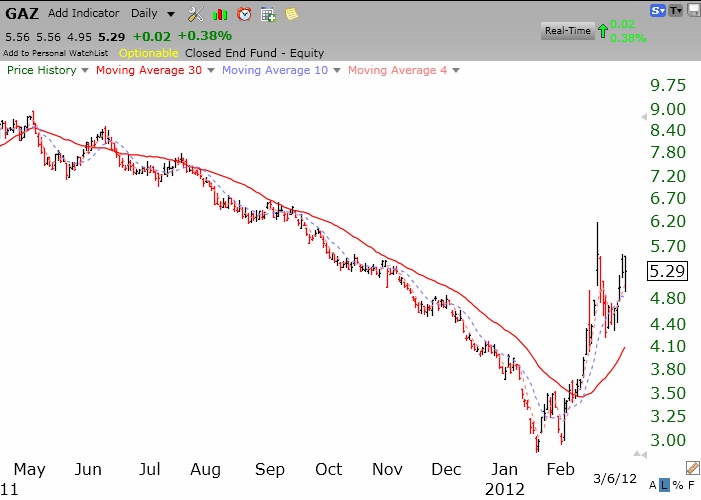
Why is natural gas (GAZ) rising on its highest volume ever?   I own some of this commodity ETF.


47th day of QQQ short term up-trend; AAPL and market weakening

GMI5/6
GMI-26/9
T210869%

Market internals continue to weaken.   T2108 down to 69% It appears from the weak futures that the post-earnings period decline is upon us.   A lot of people may be selling AAPL ahead of its Wednesday product announcement instead of waiting until afterwards.   AAPL might therefore present a buy signal in the next few days. The GMI buy signal from 12/23 remains in effect.

GMI at 5 and T2108 falls to 71%

GMI5/6
GMI-26/9
T210871%

The market has weakened just a little.   This week we will see if AAPL will fall after its product news is released.   If it does, we might get that several week post earnings release lull until the end of March when mutual funds will engage in window dressing of their portfolios so they will look good to investors.   We might then see a rise as first quarter earnings are released in early April.   I am hoping this scenario comes true. Meanwhile the GMI dropped one, to 5 but the buy signal of 12/23 remains intact. Friday was the 46th day of the current QQQ short term up-trend. The T2108 is finally moving out of over-bought territory, but is still far above the level where a new up-trend in that indicator typically begins. With these mixed signals, I am inclined to wait a few days to see if this market rally holds up.