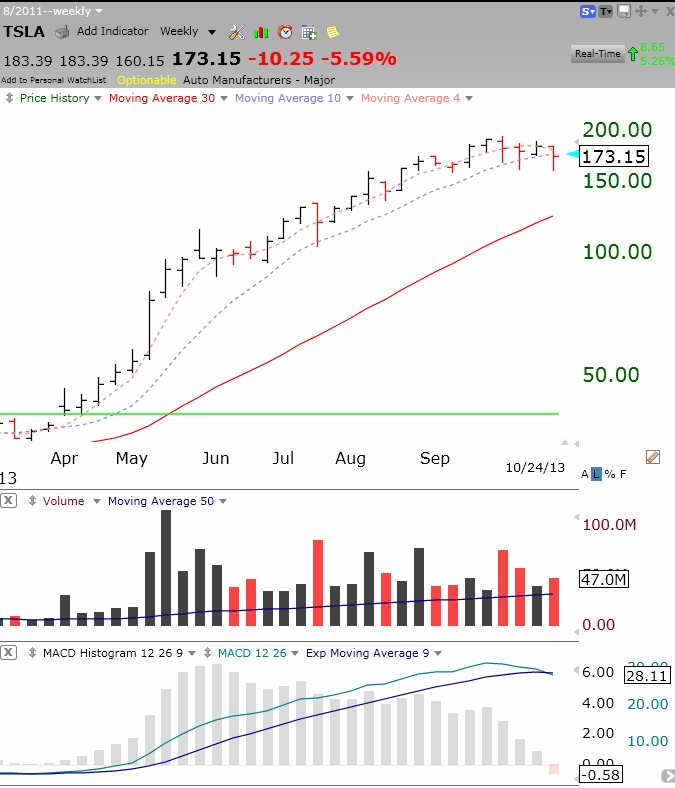
For the first time since its green line break-out last April, TSLA may close below its critical 10 week average (dotted blue line). Other danger signs are closing down 3 weeks out of the last 4 on elevated volume (red bars) and the weekly MACD histogram has turned negative (red), revealing weakening momentum. TSLA bounced from oversold levels on Thursday. If TSLA closes below yesterday’s low of 162.83, I would expect more of a decline. If it holds this level then I think it is a shake-out, to be followed by a resumption of the up-trend. Pre-market, TSLA is up. It remains in a Stage 2 longer term up-trend, with support around 123 (red line). Earnings are expected on Nov. 5. What do you think? (Click on chart to enlarge.)
A lower low would indicate weakness. IBD puts weight on the close below the 50 dma on heavy volume. That is something to watch for.
I think if TSLA does not go up, it will go down. Additionally, the 8% rule has to be taken with a grain of salt; my INVN went down 9% in 2 days, but rebounded back the next day. Dr. Wish’s ARMH was stopped out on 8%, but now the stock is rebounding! So the 8% rule does not apply all the time, everywhere!
Perhaps TSLA could move sideways?