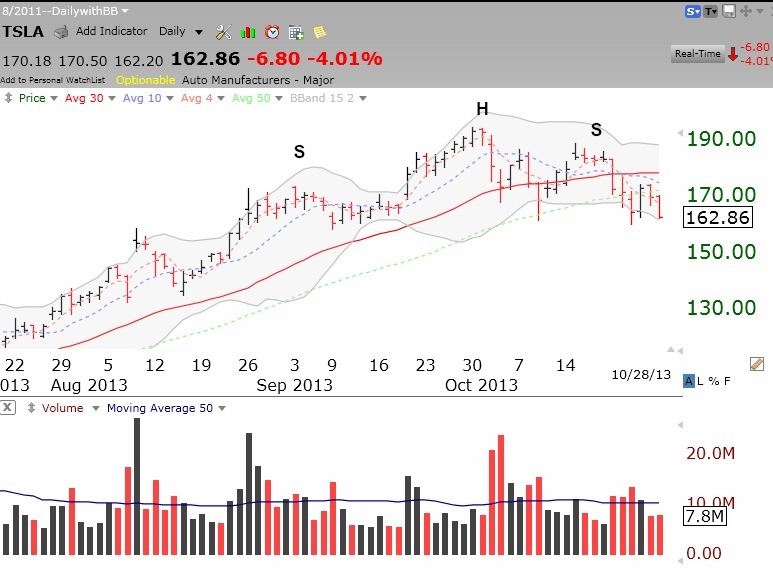
Is TSLA forming a head and shoulders top? Check out this daily chart. TSLA may be on the neckline. A penetration could lead to a sharp sell-off.
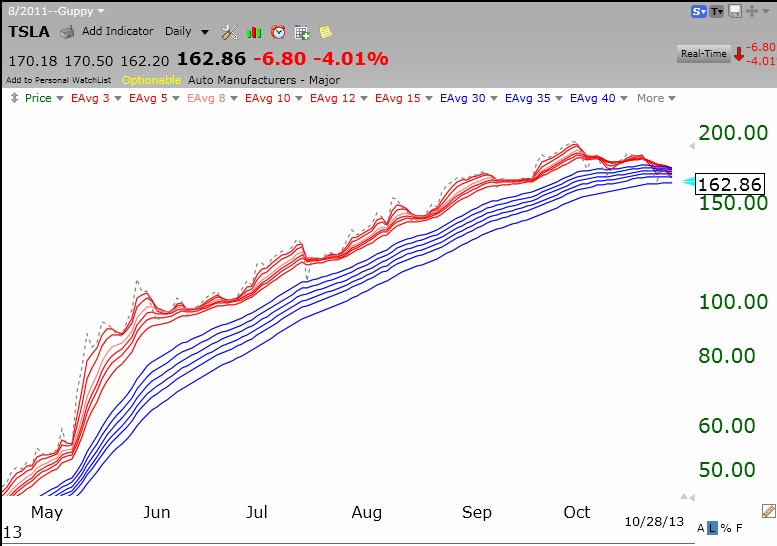
 This daily GMMA chart shows that the RWB pattern is gone, with the shorter averages (red) about to cross below the longer averages (blue).