As you know, I have been involved in the market since the mid 1960’s. I have seen up and down markets. One of the things I have noticed is that when people I know who have little interest in the market (because they are scared or cautious) begin to tell me they are buying stocks, I become a little more cautious. Also, when most of my holdings are climbing rapidly we are near a top–and they are! The market has been in a short term up-trend for 52 straight days. The QQQ has closed above its critical 10 week average for 25 straight weeks (including this week). I have also seen declines begin in January. So, just because it is a new year does not guarantee an immediate continuation of this up-trend.
This market is being driven by extraordinary low interest rates. Money seeks the place with the best yield with the least risk. For the past three years there has been no way to earn a decent return except in stocks (and some real estate). Of course, those who bought bonds when their yields were high have seen their bond prices rise tremendously, but this situation is probably over. The Federal Reserve members are now poised to take their collective feet off of the gas pedal. As interest rates rise, it will begin to draw money out of this relatively risky stock market and the market will top.
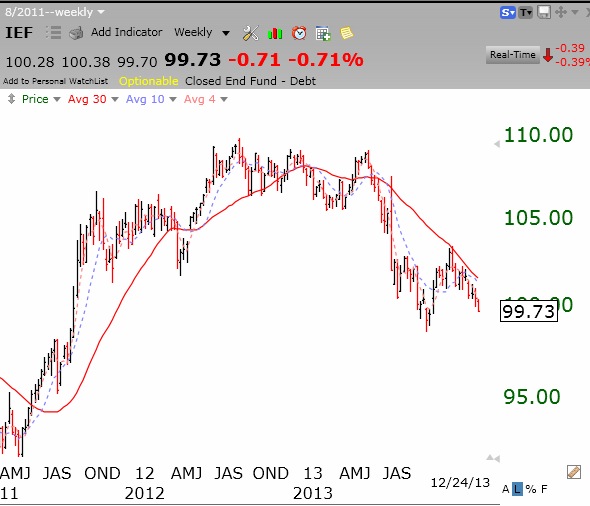
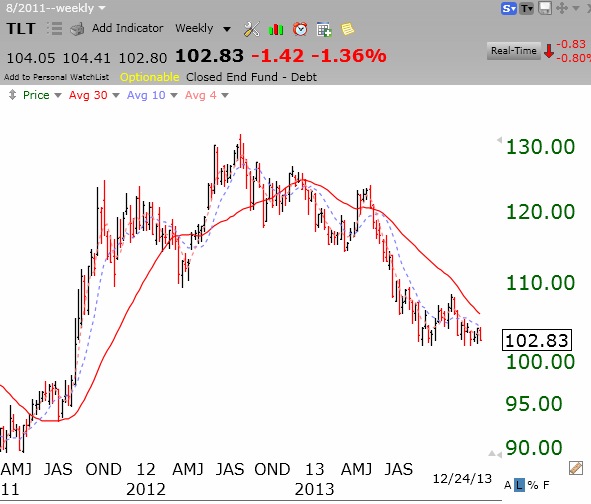
Look at this weekly chart of IEF, the ETF which tracks 7-10 year treasury bonds. As IEF declines it means interest rates are rising. IEF is clearly in an ominous Weinstein Stage 4 decline (much like gold has been in). The same is true of longer term rates, reflected in TLT. Thus medium to long term interest rates are clearly rising! How much will rates have to climb before people start moving their money from the stock market into treasury bonds? It will depend on a combination of the rates available and how the market is behaving. When a stock market decline sets in, people will become more cautious, and seek the relative safety and better yield of treasury bonds. (Most boomers also do not have the luxury of waiting for their accounts to recover from a new extended market decline.) And then the whole cycle begins again. Rising rates lead to falling bonds which leads to a down market which leads to lower rates and a rebounding market.
TLT shows 20 year bonds also in an identical Stage 4 decline:
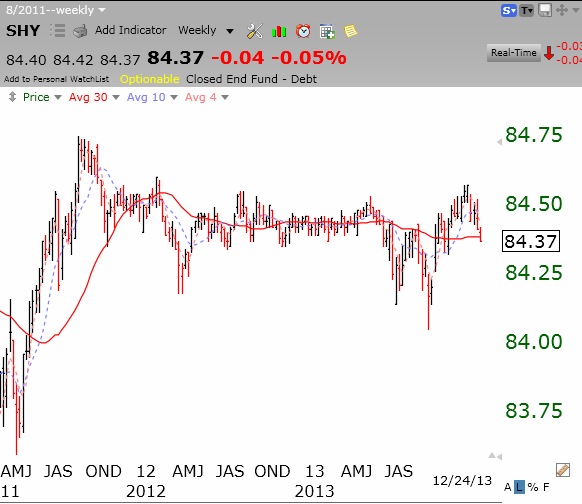
Only the very short term rates are stable, as promised by the Fed. Check out this weekly chart of SHY, which reflects 1-3 year treasury bonds:
The charts above show that the economy is clearly experiencing rising medium and long term interest rates. This scenerio will eventually hurt the stock market. Nevertheless, you know I remain a trend follower and I try to respond to the market, rather than move early in anticipation of Mr. Market’s turns. My GMI indicators are all positive, so I will stay invested long. However, I am going to resist the temptation to add more money to my positions or take on new ones. I will wait for at least a small general market decline and an ensuing bounce. I will also move my stops up and exit anything showing weakness or becoming extremely extended or overbought. I remain fully invested in mutual funds in my university pension, which limits trades.