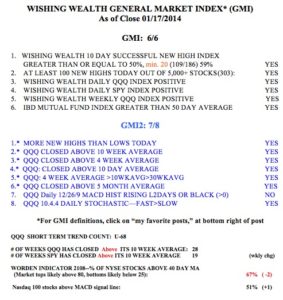
All indicators remain positive.
Month: January 2014
$AAPL flashing warning signs; 68th day of $QQQ short term up-trend
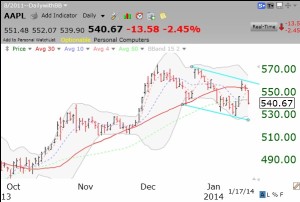
I wrote a few days ago that AAPL broke its critical 10 week average and then rebounded. However, tt then closed the week back below its 10 week average. This daily chart shows that AAPL has now created a lower high and lower low. These pivot points were used to draw the turquoise channel lines. AAPL’s 30 day average (red solid line) is also curving down, another technical sign of weakness. When the 30 day average is declining, it means that the current day’s price is below its price 30 days ago.
A weakening AAPL can often correspond to a weak Nasdaq 100 ETF (QQQ). With last Friday being the 68th day of the current QQQ short term up-trend, I am looking for a minor top. Since 2006, the four longest QQQ short term up-trends were: 67, 75, 80 and 88 days. In other words, only three of the 52 QQQ short term up-trends since 2006 lasted longer than the current one. Records are meant to be broken, but I would not bet my money on it. I have to respect the probabilities. As I have said before, a short term down-trend often lasts only a few days, so we might just get a brief pause in this up-trend, but who knows? The 75 day up-trend was followed by a 44 day down-trend, the 80 day by a 23 day down-trend and the 88 day up-trend was followed by an 11 day down-trend…..
This weekly table of the GMI shows that the QQQ has closed above its 10 week average for an amazing 28 weeks! I tend to exit the market in my trading accounts when the QQQ closes below this critical average. With the GMI at 6 (of 6) and the GMI-2 at 7 (of 8), the market remains strong, but I am still watching for any signs of weakness.

