After 64 days, the QQQ short term up-trend could end on Tuesday with a down or flat day. (IBD now declares uptrend under pressure.) It was a great, long ride! The QQQ is on several levels of support that I monitor, so that index could bounce up by Tuesday’s close. If it does, the key for me is whether that bounce will hold through Wednesday. A failed bounce could lead to a large decline. I cut back on my holdings in my trading accounts on Monday. Remember, a market always falls faster than it went up, and this market rose pretty fast.
Month: January 2014
63rd day of $QQQ short term up-trend; $AAPL sends signs of weakness
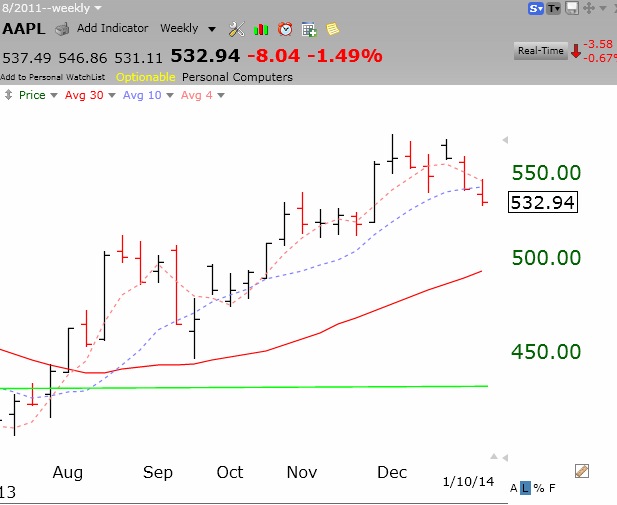
I told you that I have successfully traded AAPL by holding it when it closes above its 10 week average and exiting when it closes below. AAPL has now closed below its 10 week average (blue dotted line) and I have exited the stock. This weekly chart of AAPL also shows that AAPL remains in a Stage 2 up-trend (above its rising 30 week average, red line) with support around 493. But do I want to hold it if it falls to there?
Another way to look at it is through the Guppy GMMA chart. Note that AAPL has now closed below 5 of its 6 shorter moving averages (red lines). The dotted line is the closing price each week. This indicates considerable weakening of its up-trend.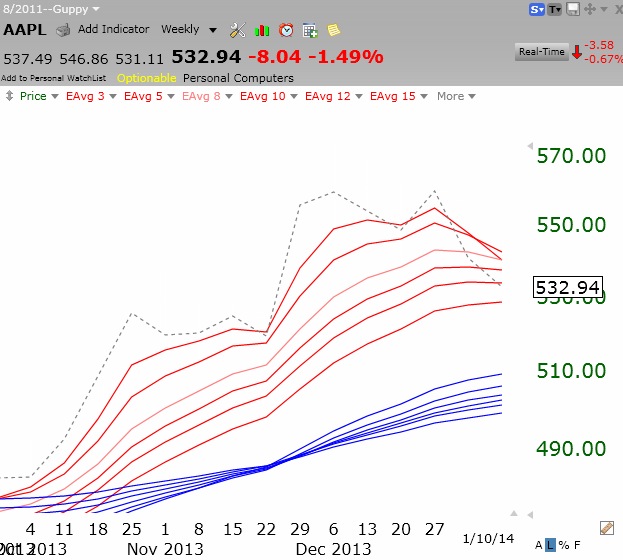
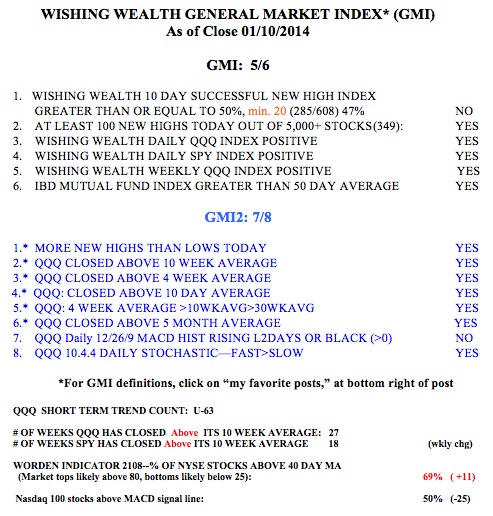
With AAPL being a heavily weighted ingredient in the QQQ showing weakness, this index may also have trouble continuing its up-trend. Furthermore, the up-trend is 63 days old, rather long for a short term up-trend. With more than 60% of advisers in the Investor’s Intelligence most recent poll reporting that they are bullish, I suspect this is not the time to be hanging on to a lot of positions in tech and growth stocks. I am ready to exit quickly if the GMI and GMI-2 weaken.
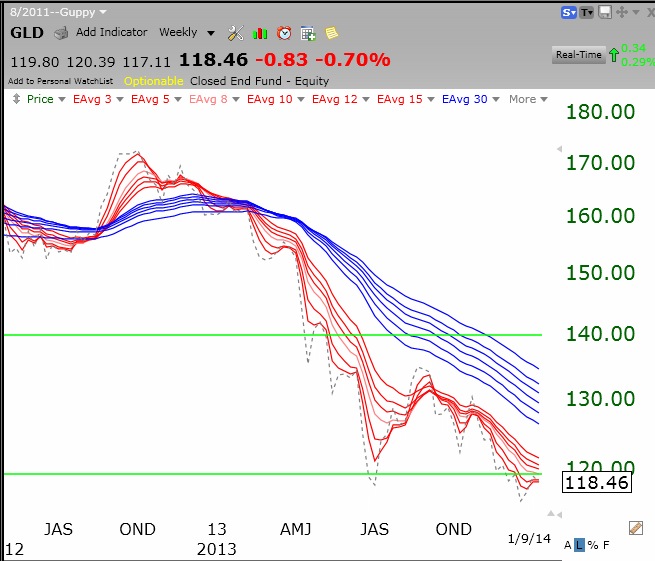
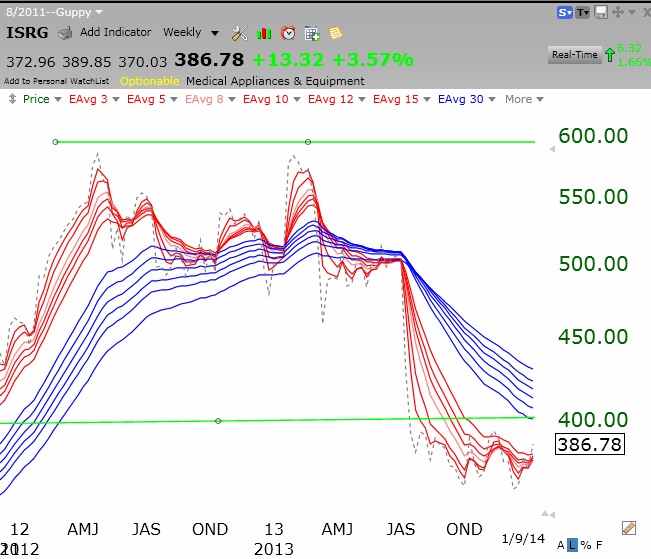
62nd day of $QQQ short term up-trend; $GLD and $ISRG in BWR down-trends
Yesterday I showed you the RWB rocket stock pattern and how it helps me to identify strong stocks. Tonight I will show you the reverse, the BWR pattern, that can keep me out of stocks in a major down-trend. You can see from this weekly Guppy chart of GLD, how it alerted me early on to the down-trend in gold. Who in their right mind should have been long gold in 2013?
This chart shows ISRG’s transition from an RWB up-trend into a BWR down-trend.
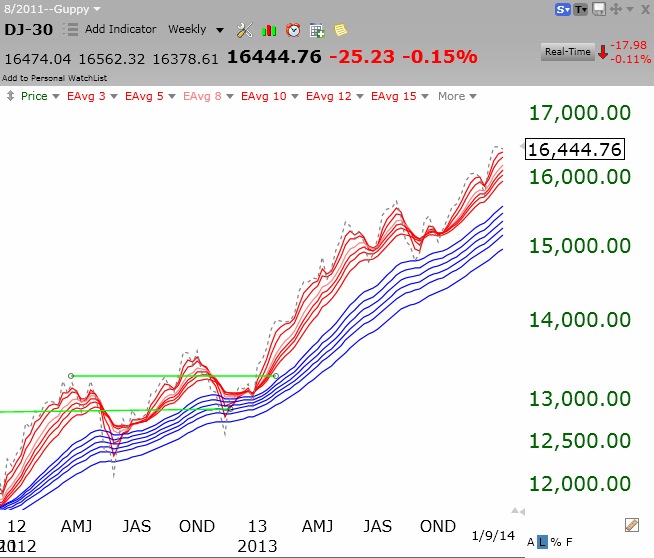
A weekly Guppy chart is all I need to determine the longer term trends of a stock, ETF or mutual fund. Guess what pattern the Dow has……..