The market came back enough on Friday to open the possibility of a meaningful bounce. The QQQ and AAPL closed just above their 10 week averages. This week will tell us if this rise will hold. On the bull side is the fact that the T2108 and the daily stochastic indicators reached oversold extremes last week, and the QQQ has found support at its lower 15.2 daily Bollinger Band. On the bear side is the fact that this bounce has been weak, coming after a high volume decline. The question is whether the market can rebound to new highs or whether this rebound will fail and lead to a larger decline. Check out this daily chart of the QQQ.
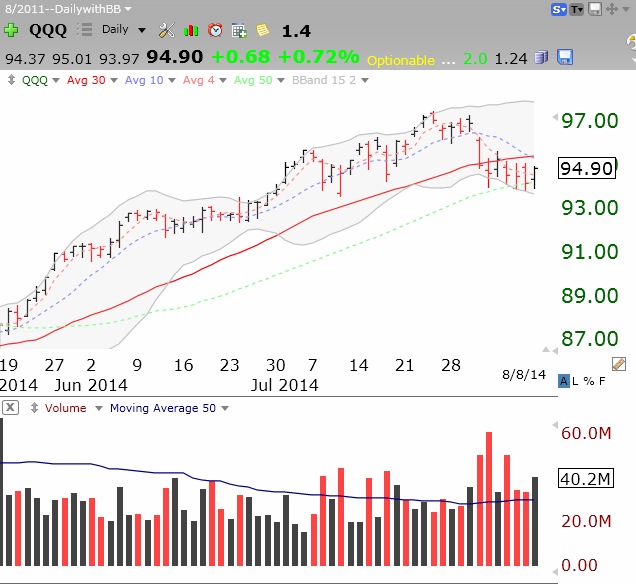
The recent red spikes indicate daily declines on above average volume. The QQQ is holding right above its 50 day average (green dotted line). But the 10 day average (blue dotted line) is crossing below the 30 day average (solid red line) for the first time since April. The QQQ would need to close above 95.44 for me to have confidence in a bull move. AAPL also has a similar pattern. Thus the next few days are critical.
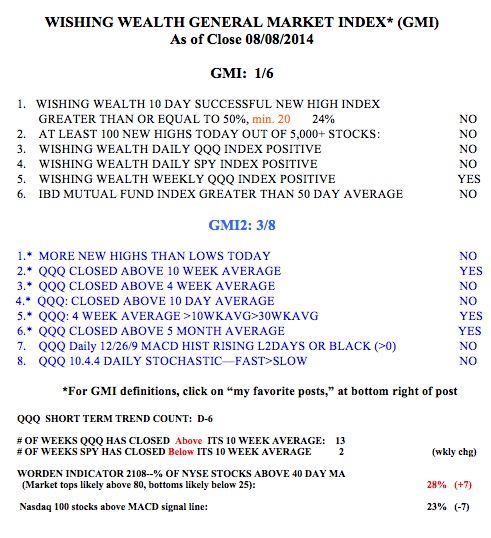
The GMI registers 1 (of 6) and remains on a Sell signal.