The sharp rise on Friday came from very over-sold levels. Given that the market often is strong towards the end of the year, I would not be surprised to see a rise that takes us through mid-January. But with people being worried by Ebola and the Fed’s cessation of QE , this market could resume its decline at anytime. I therefore took a very small amount of my university pension out of the market on Friday. If the market rises to likely resistance levels, I will take more of my pension out of mutual funds, just in case. With the GMI at “0” I am very cautious. I am already mainly in cash in my trading accounts. Things are just too volatile for everything but my most speculative trading funds. I have repeatedly written that I trade like a chicken. If I am wrong, and the GMI returns to a Buy signal, I can always go back in……
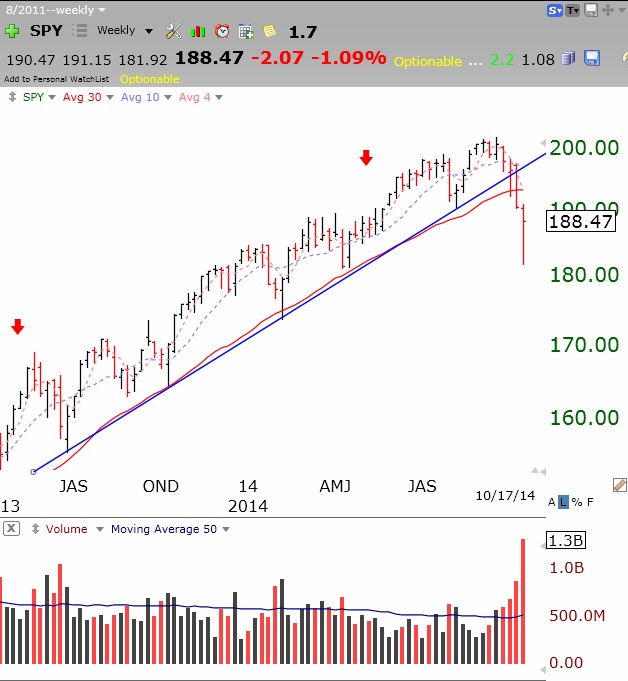
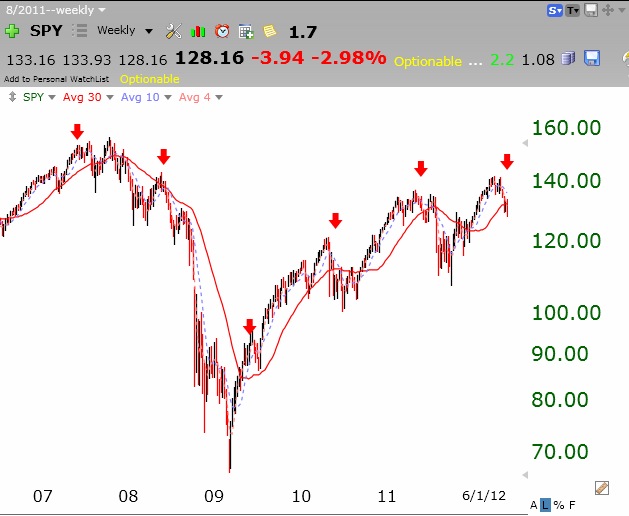
As this weekly chart of the SPY shows, a major up-trend (blue line) support line that lasted for more than one year has been broken. Also ominous is the fact that the critical 30 week average (red line) has been penetrated and there are large red spikes indicating high volume selling by institutions. I would not be surprised to see the current rebound touch the 30 week average again, now around 193. If that average curves down, that will be my signal to begin taking all of my university pension out of the market. (I did that in 2000 and 2008.) That would signal the possible beginning of a Weinstein Stage 4 down-trend.
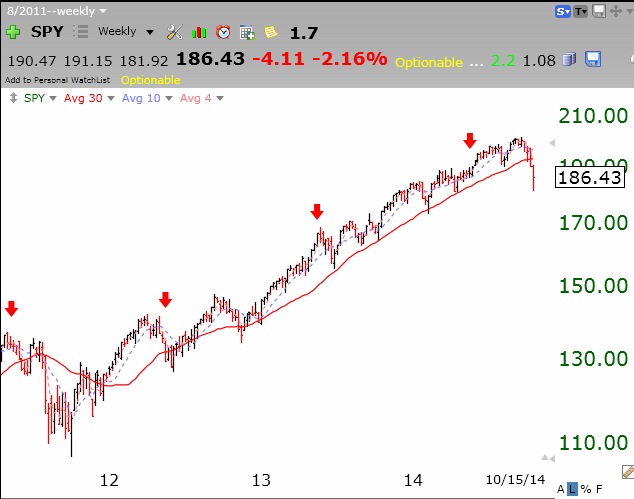
Look what has happened when the 30 week average curved down. (Ignore the red arrows, left over from a Sell in May analysis.)
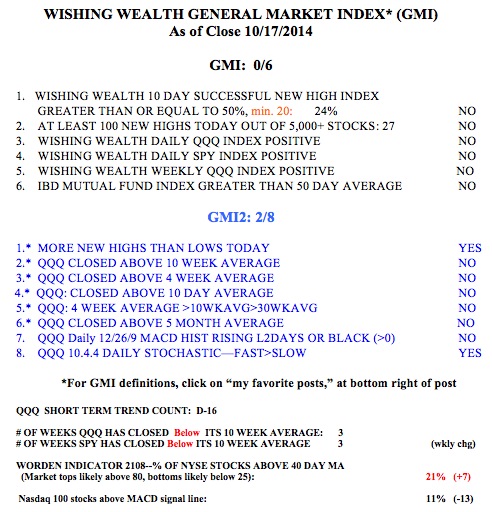
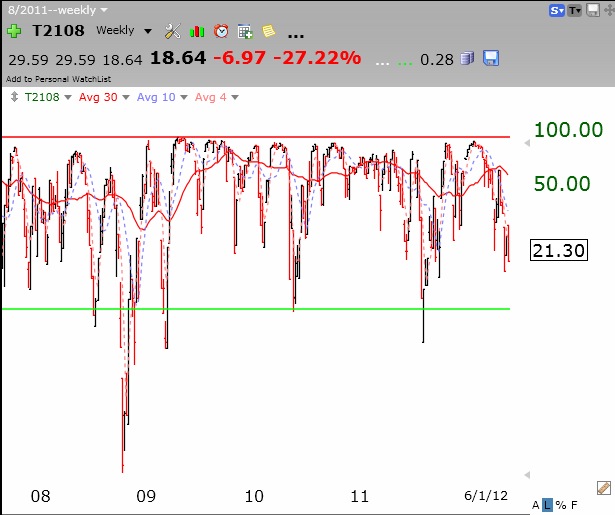
If I think a Stage 4 down-trend is imminent, I will sleep soundly with most of my money on the sidelines until the GMI signals a BUY and the market enters a new confirmed Stage 2 up-trend. (I might also buy some SPY before those events occur, if the Worden T2108 gets down to single digits, where most market wash-outs since 1987 have ended.) The T2108 rebounded to 21% on Friday, after reaching a recent low of 13%. Dramatic market declines typically end below the green line on the chart, which is drawn at the 10% level. (Note we are not there yet!)…..
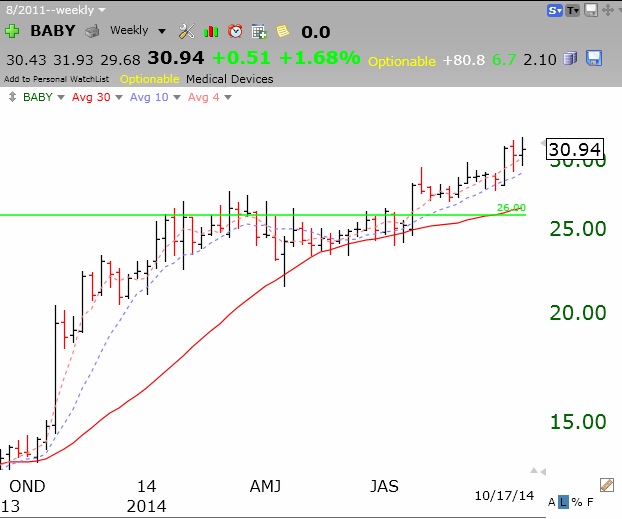
You know I do not like to take a new long position on anything during a market down-trend. But when a stock keeps hitting new all-time highs and coming up on my scans it signifies amazing relative strength and I add it to my watch list for close monitoring. I don’t know why BABY is so strong but someone else apparently does. Check out this weekly chart of BABY, which had a successful green line break-out to an all-time high 13 weeks ago. BABY’s crawling higher just showed up in my Darvas scan, which looks for stocks that have characteristics that I think Nicolas Darvas used to like. Of course, Darvas type stocks only out-performed in rising markets and BABY could stage a temper tantrum at anytime……