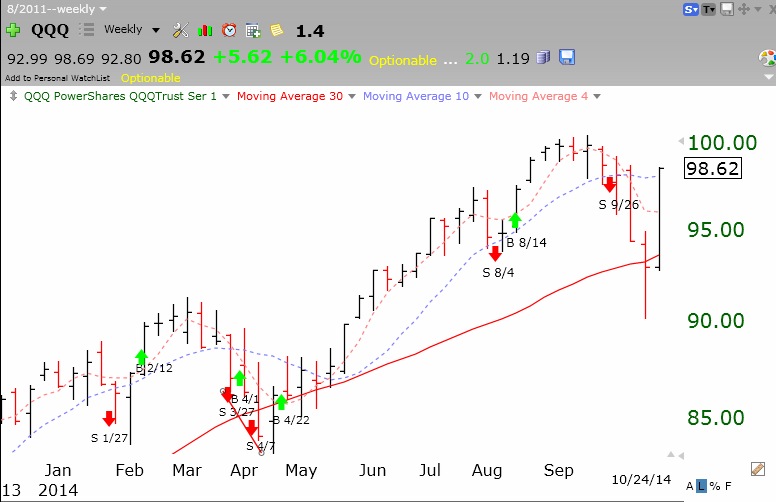
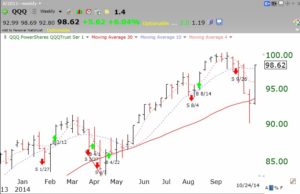
The snap-back in my indicators was quick and extraordinary. A new QQQ short term up-trend has begun. However, it has to last 5 days for me to heavily accumulate TQQQ, the 3X leveraged bullish QQQ ETF. I did take a small position in TQQQ at the end of the day on Friday. Buying right after a technical buy signal is actually low risk to me, because if the technical buy signal fails, I can quickly sell out with a relatively small loss. The GMI is above 3, and one more day there and the GMI will flash a Buy signal. Most important, the QQQ is now back above its critical 30 week average (red line), indicating that the Stage 2 advance is still intact. The SPY and DIA also retook their 30 week averages last week.
We are entering what is typically the strongest period for the market, the fourth quarter. (“Buy stocks on Halloween!”) I expect the strong popular stocks to be bought by the mutual funds so their end-of-year reports will include the winners in their portfolios. In this way the fund managers look smart for owning them, even though they may have just purchased them at high prices. It’s all about looking good so potential customers will buy their funds and pay their exorbitant management fees. (Why buy mutual funds when one can buy index ETFs, with their cheaper management fees?)….
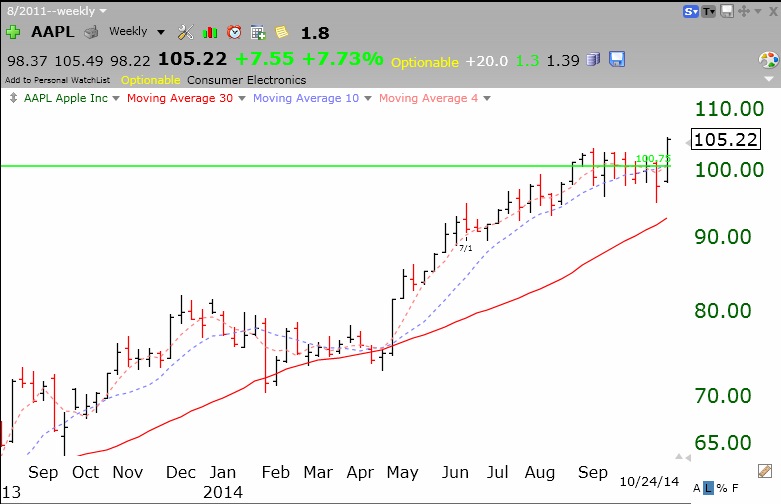
Speaking of stocks that institutions will want to own at year’s end, AAPL has regained its critical 10 week average. I have repeatedly found it profitable to own AAPL as long as it stayed above its rising 10 week average. AAPL has again broken above its green line and is well above its 10 week average (blue dotted line). Stocks can sometimes consolidate after a green line break-out (GLB), especially if the market becomes weak. The fact that AAPL came through the recent market turbulence at an all-time high shows impressive relative strength and bodes well for the end of year rally and accompanying mutual fund window dressing.

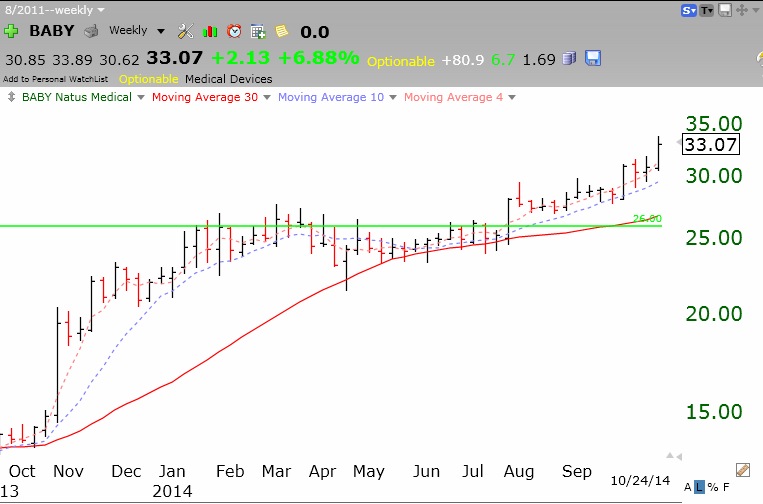
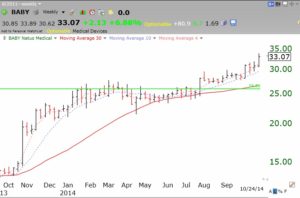
Another recent GLB that I have written about is BABY. BABY is showing a lot of strength, having plodded higher amidst the recent market turmoil. Notice how it is hugging its rising 10 week average (blue dotted line).
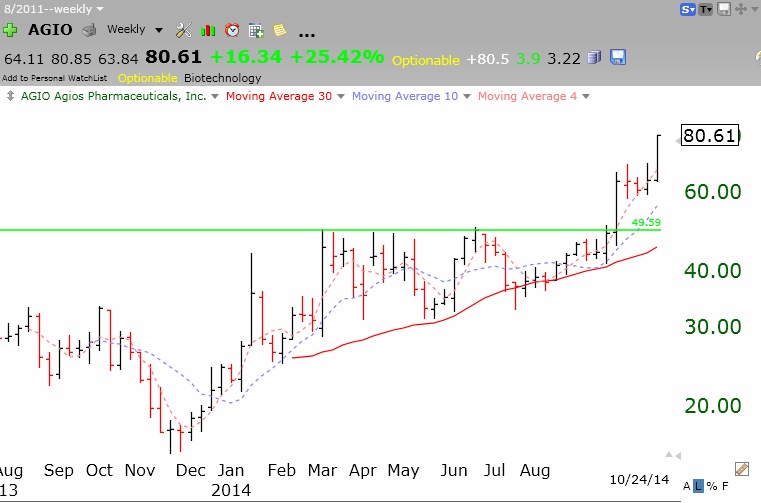
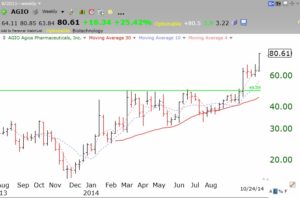
 AGIO is another biotech with a recent GLB, that is showing considerable strength.
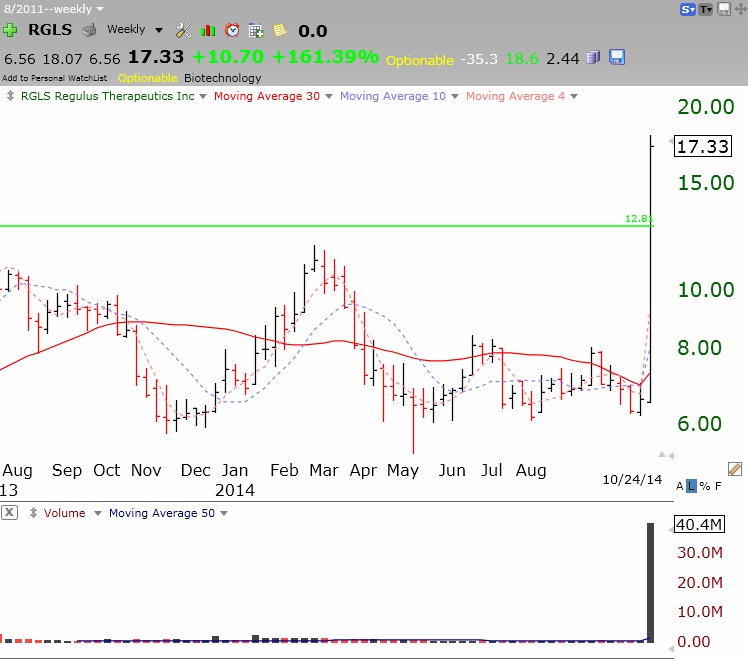
A reader wrote to thank me for posting Judy’s first comment to me about RGLS. As my long time readers know, Judy is an incredible stock picker and my stock buddy. Judy reads technical reports voraciously and uncovers gems , often bio-techs, that are working on promising drugs or inventions. She then buys a little and holds them for a long time, if she believes they have a great concept. Unfortunately, I do not have the confidence to hold such stocks for a long time through thick and thin. I have lived through too many bear market declines where everything gets decimated. Anyway, Judy talked to me again and I posted a second time about the prospects for RGLS in Decmber, 2013. At least one reader apparently bought it. Look at what RGLS did last week. Note the GLB last week and its huge volume! Is this the start of something great? (Remember though, clinical trials are risky.)
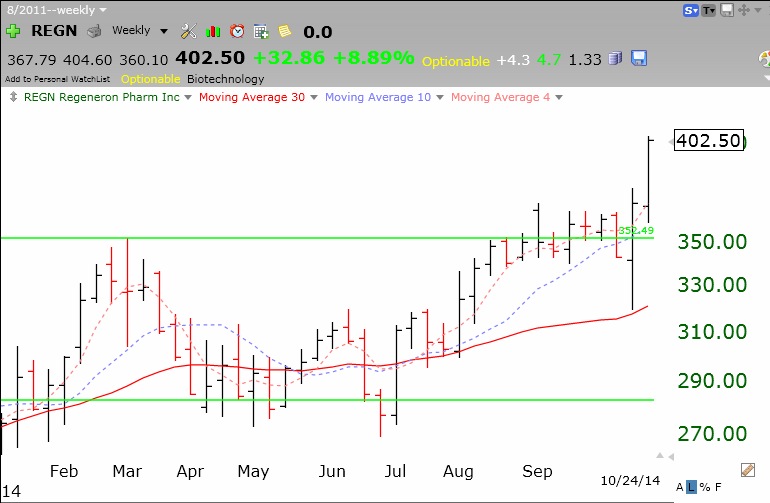
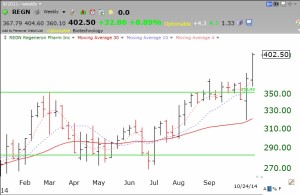
 Another stock that Judy has been urging me to buy is REGN, another recent GLB, which Judy has talked about for a long time. REGN is running clinical trials for several new drugs, including a potential new blockbuster drug for treating high cholesterol. This weekly chart shows a GLB, followed by a multi-week consolidation.
Here is the weekly GMI table. Note that while the QQQ is back above its 10 week average, SPY is not. The large cap industrial stocks are lagging this rebound. This market is not out of the woods yet.

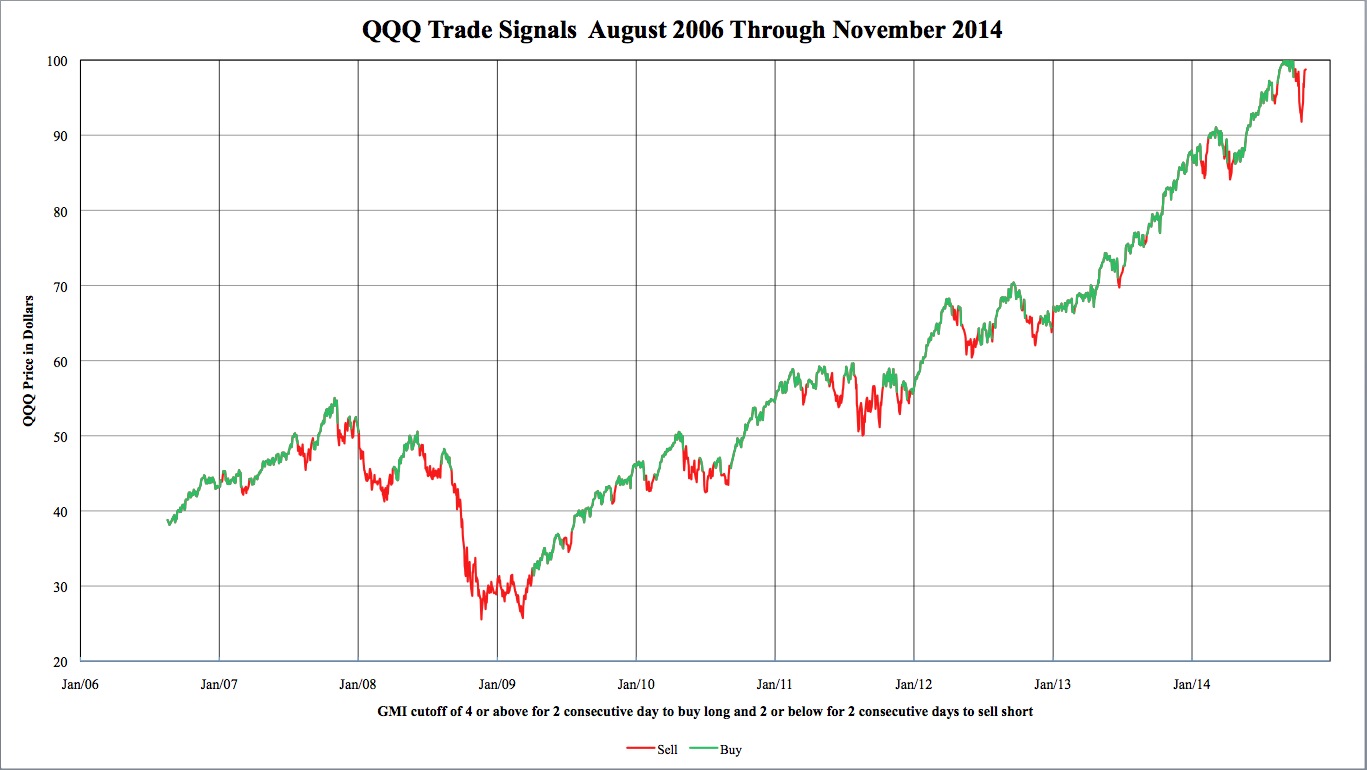 The GMI is now back to a Buy signal as of Monday’s close. Two consecutive closes above 3 yield a Buy signal. Monday was also the second day of the new QQQ short term up-trend.
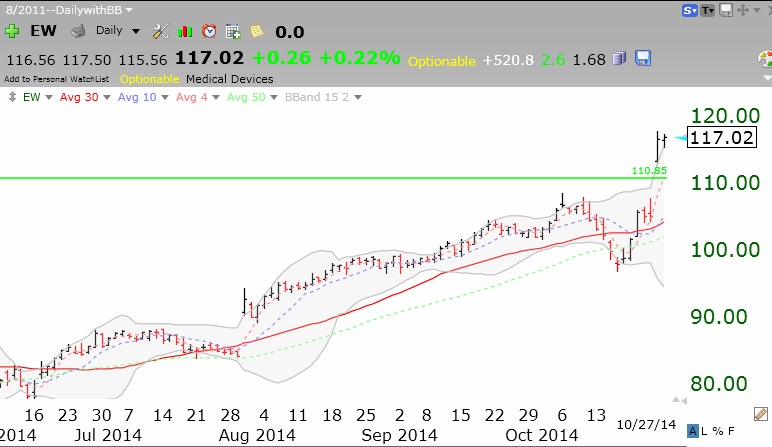
 Speaking of GLB stocks, EW had a huge break-out last week. Check out this daily chart of EW.