In spite of the decline on Tuesday, it was surprising to see that there were 171 new highs. So I looked at where they were. I was amazed to find that one half of the new highs were REITs! Could it be because REITs tend to pay more yield or is it that people are afraid of stocks and moving toward real estate? Any ideas?
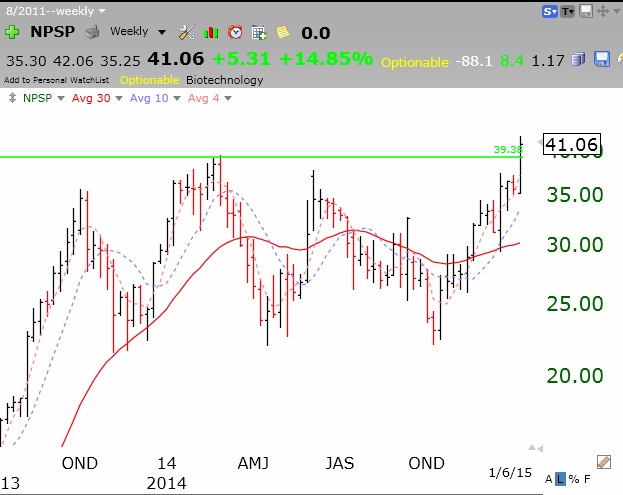
Biotechs continue to outperform and many have been rising in this declining market. I noticed that NPSP had a high volume green line break-out to an all time high on Tuesday. Check out its weekly chart. There is chatter about a takeover. Any stock that can come through this market at an all time high has something going for it.
With the GMI below 3 (at 2) for a second day, it now signals Sell. I am hedged and not looking for long positions now. The GMI has done a great job getting me out of declining markets.
REITs tend to outperform when long-term interest rates are dropping or the yield curve is flattening. If you chart VNQ:SPY, XLU:SPY, TLT:SPY, and $YC2YR you see some areas of high correlation such as 04/2010-10/2010, 04/2012-10/2012, and 2014 until the present day. While VNQ has a positive correlation with SPY, it is expected to outperform under the current conditions. Not a perfect rule, but definitely a useful one in the current environment.
Yes…I noticed my VNQ holding has been doing great.
Ever use ETF screen?
Riets among top performering ETFs.