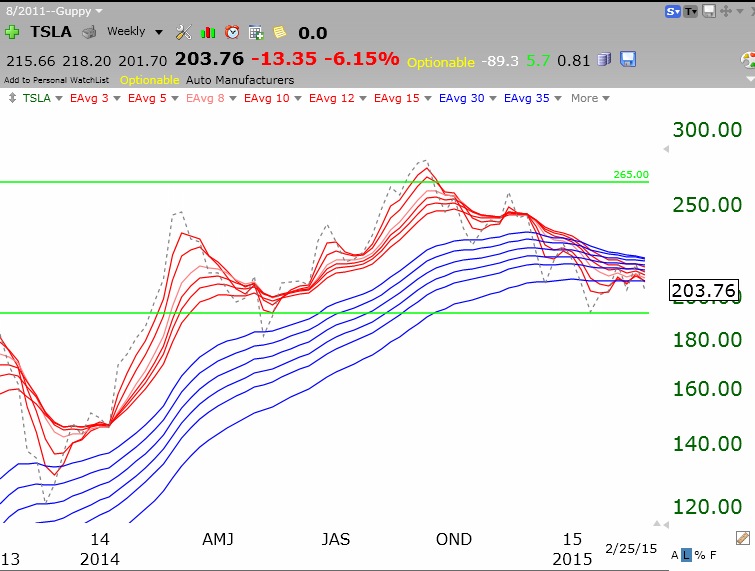
TSLA has a troubling GMMA chart.
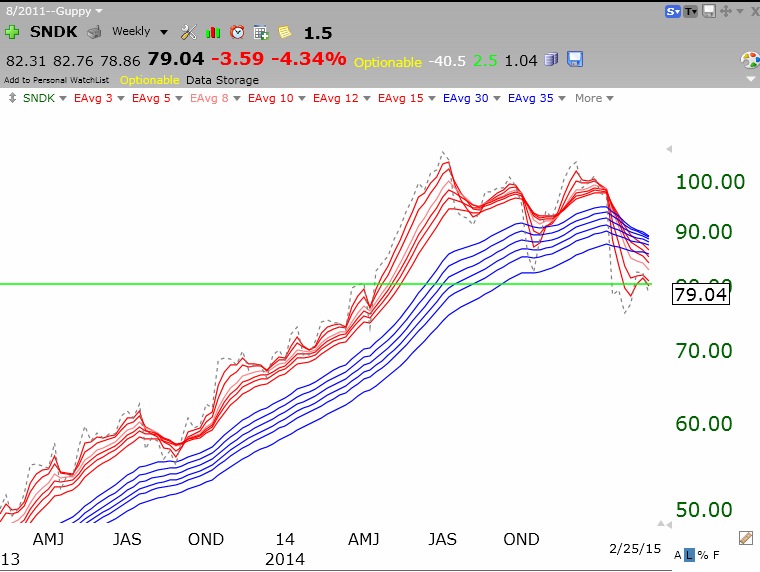
 As does SNDK:
Share this:
- Click to email a link to a friend (Opens in new window) Email
- Click to share on Facebook (Opens in new window) Facebook
- Click to share on X (Opens in new window) X
- Click to share on LinkedIn (Opens in new window) LinkedIn
- Click to print (Opens in new window) Print
- More
- Click to share on Pocket (Opens in new window) Pocket
- Click to share on Pinterest (Opens in new window) Pinterest
- Click to share on Tumblr (Opens in new window) Tumblr
- Click to share on Reddit (Opens in new window) Reddit
- Click to share on Telegram (Opens in new window) Telegram
- Click to share on WhatsApp (Opens in new window) WhatsApp
again out of curiosity…
TSLA, from 10/14/2011 (when there is enough data for the long EMAs):
RWB*: Profit 495%, MaxDD 36%
(buy when short EMA above all long EMA, sell when short below all long)
RWB**: Profit 454%, MaxDD 36%
(same buy rule, but sell when the short EMAs are under the just the highest long EMA)
B&H: Profit 626%, MaxDD 36%
For SNDK:
RWB*: 254%, MaxDD 84%
RWB**: 242%, MaxDD 83%
B&H: Profit 1755%, MaxDD 93%