THE $LL debacle–GMMA gave clearer warning than Stage Analysis

GMI6/6
GMI-27/9
T210864%

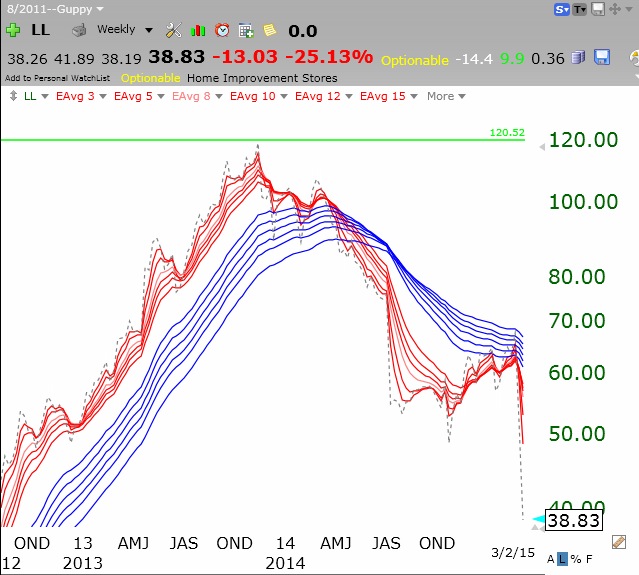
If you watched 60 Minutes on Sunday night you know why LL fell out of bed on Monday, down -25%. But should anyone have been holding LL stock recently?   My students would have probably been out of LL simply by looking at a weekly chart and applying Weinstein’s Stage Analysis technique. LL was below its 30 week moving average, which had topped out a year ago. LL closed below its 30 week average last week after spending a few weeks above it in January and February.   This could have caused a head-fake as a possible beginning Stage 2 advance, but note that LL was below its final green line top at around $120. I tell students only to hold stocks above a stock’s last green line top. The solid red line in this weekly chart is the critical 30 week moving average. Notice the strong Stage 2 up-trend throughout all of 2013.   I only own stocks that are in Stage 2 up-trends.

LLweekly03022015
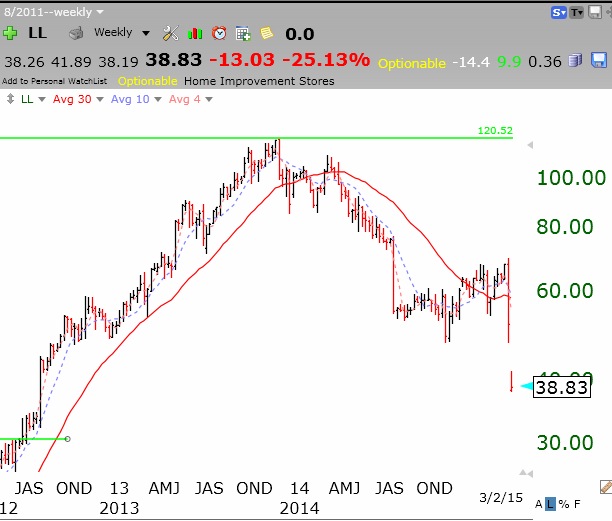
I decided to also look at the weekly modified GMMA chart for LL. I was struck by the fact that this chart did not show the recent head-fake in January and February.   The RWB pattern had clearly ended in 2013 and we never got a RWB pattern since. The GMMA chart clearly provided the better indication that one should not have been in LL since at least June, 2014, when a bearish BWR pattern became evident. Beware the whites of their charts!

LLGMMA03022015

On my use of the GMI, A Darvas type RWB rocket stock: $AMBA

GMI6/6
GMI-28/9
T210864%

Most of my readers know that using many of the indicators counted by the GMI (see box at bottom of this page) I was successfully able to stay out of the market during most of the 2000 and 2008 declines. After a bottom was in I reinvested on the long side. The GMI has a very good track record but every time it turns to a Sell does not signify to me that a major decline is beginning. In the past, the 30 week average of the QQQ had to turn down to get me to pull my most conservative pension money out of the market. In spite of the fact that this critical moving average did not turn down in the past year, I mistakenly (in hindsight) took most of my university pension out of mutual funds and put the proceeds into money market funds. The huge increase in my pension account since 2009 together with my fear of losing the gains caused me to ignore my primary rule and to prematurely go to cash.   I am back in the market now. I wanted to clarify this situation for my readers, many of whom are interested in knowing what I am doing with my pension account. As one gets closer to retirement, s/he must deal with the fear of losing needed savings versus staying invested.   This is a very difficult challenge for boomers who wish to manage their money. I use the GMI and my short term trend count to guide my trading in my most speculative and short term accounts….

As you know, one of my most celebrated stock gurus is Nicolas Darvas, who made a fortune in two years in the 1950s by teaching himself how to trade. His book (How I made $2,000,000…” is listed to the right of this post and is the first book I assign to my university students. Over the years I have designed an EasyScan in TC2000 that scans all stocks for stocks that I think might have met Darvas’ selection criteria. I ran the scan of almost 6,000 stocks this weekend and it came up with 46 stocks. (I talk about the Darvas scan in my 2012 Houston TC2000 webinar video, whose link is in the green box on this page.) Below is one stock, AMBA, that came up in the Darvas scan and that is also   above its recent green line all-time top. This modified weekly GMMA chart shows that AMBA has the RWB pattern and recently broken above all of its shorter term averages (gray dotted line above all red lines). AMBA is worthy of my researching. Note that AMBA is due to report earnings this week, on March 3rd.

AMBAGMMA02272015

Meanwhile the GMI remains at 6 (of 6) and on a Buy signal.

GMI02272015