All of my indicators are negative; 100% cash; $CURE getting sick

GMI0/6
GMI-20/9
T210821%

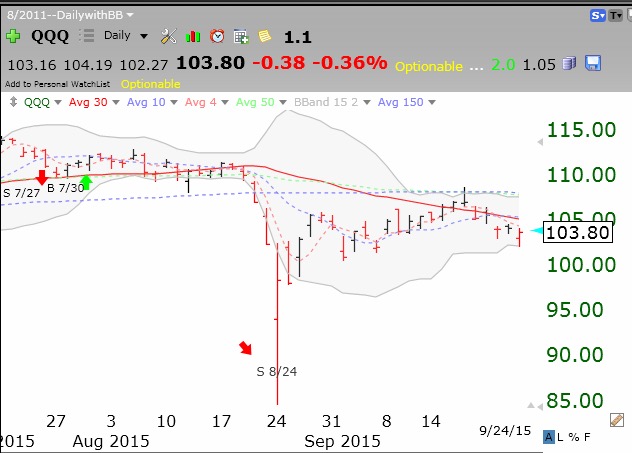
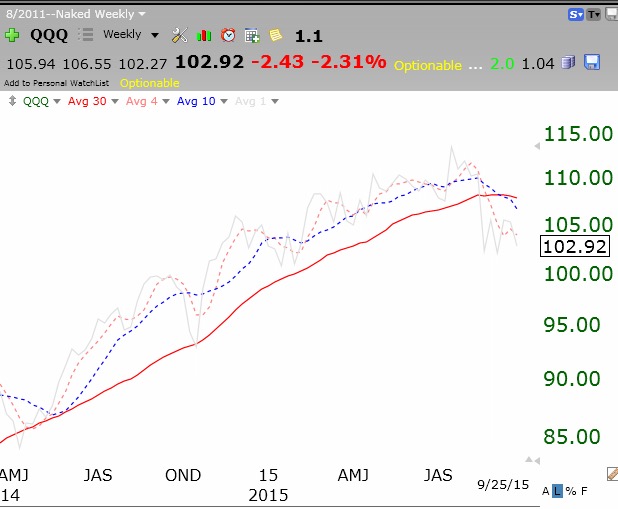
Nobody knows when this market will find a bottom. Note in this “naked” weekly chart of the QQQ, the 4wkavg(red dotted)<10wkavg(blue dotted)<30wkavg (solid red line). This is my primary definition of a   “submarine” pattern. It shows a stock or ETF in a significant down-trend. I am in cash in both my university pension and all trading accounts. There is so much time to be invested when the indexes are in a rising   “rocket” pattern. Note this was the case from July 2014 until recently, when the blue dotted line was rising above its rising red line. When the 4 and 10 lines move back above the red line, I will begin to look for long positions.

QQQ4103009252015

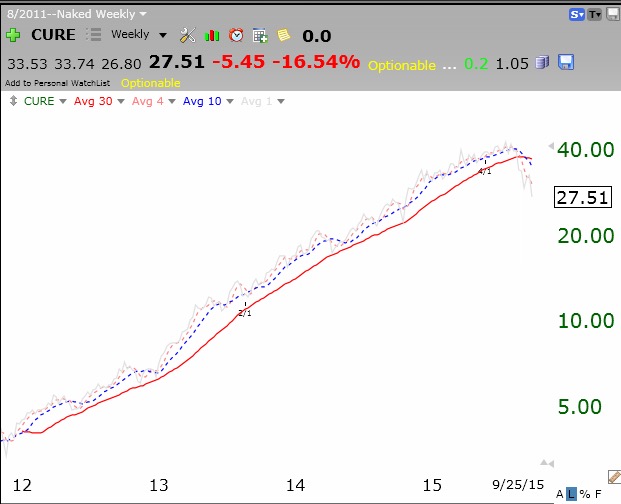
For the past 4 years one could ride the health care stocks in the 3X bullish ETF, CURE. For the first time since 2012, CURE’s 10 week average is now below its 30 week average. The leaders are starting to turn down……

CURE09252015

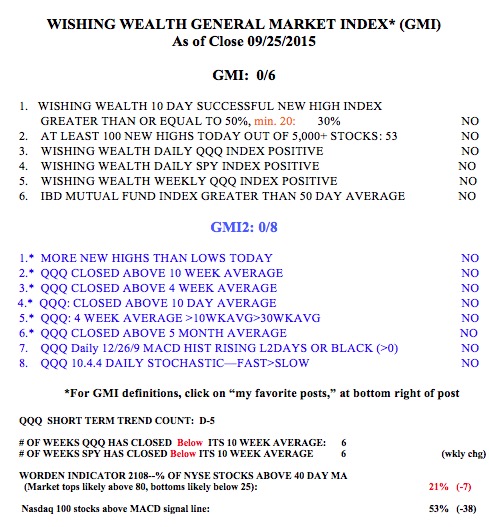
The GMI and GMI-2 are both registering 0.

GMI09252015


3rd day of $QQQ short term down-trend; mainly in cash; $AHS–green line break-out!

GMI0/6
GMI-21/9
T210822%

Ten times more new lows than new highs on Wednesday. Patiently waiting mainly in cash.

One exception is my small position in AHS, a stock my stock buddy, Judy,   told me about some time ago. This daily chart shows It had a green line break-out on Wednesday. My students should have received an alert about AHS from my TC2000 program   intraday on Wednesday.

AHS09232015Here is its monthly chart. AHS just broke its 2002 peak exhibiting a lot of strength in a weak market! Let’s see if it can hold the green line.

AHSmonthly

If you want to understand my trading strategy, check out the   link to my free 2012 TC2000 user group presentation to the right of this page.