The T2108 closed at 9, but reached as low as around 6 intraday on Friday. T2108 is a great pendulum of the market. It is in single digits only near market lows. While it did reach around 1% in the 1987 and 2008 crashes, most large declines have ended with T2108 around 6-7%. As I have written before, when the T2108 has been in single digits it has turned out to be a good time for me to buy an index ETF or mutual fund. Unfortunately I am always afraid to do it because the market and the news seem so bad at that time. Will this time be different????
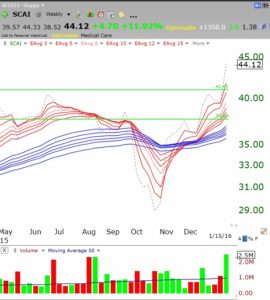
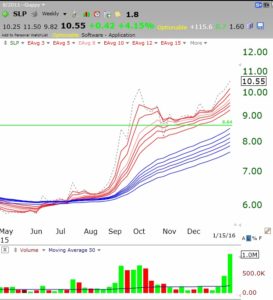
I love weak markets because the new high list is very small and it is easier to uncover the few stocks bucking the bearish trend. Sometimes these stocks can lead when the market trend turns up. So I make a list of these stocks and watch them as things develop. Two stocks showing amazing strength and trading near their all-time highs are SCAI and SLP. Both appear to have recent good earnings and are worthy of my attention. But given the current market down-trend, I am reluctant to trade them. The bear could devour them at anytime. So for now, I will watch them from the sidelines. Note their RWB up-trends and the unusual high volume last week when they rose. Both are above their recent green line tops, indicating they are near their all-time highs. The dotted line represents the closing price and note for each it is leading all of the 12 red and blue averages higher.
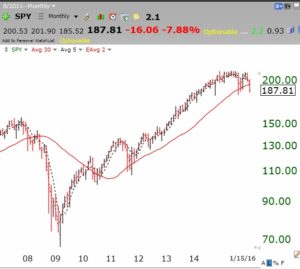
 By the way, the news media are comparing the current market decline to the vicious one from 2008. Take a look at this monthly chart of the SPY. A picture is worth a 1,000 words, maybe a million words from a stock market media pundit! (It’s too early to say this is like 2008.)
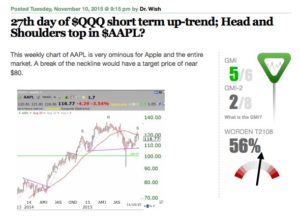
I thought you might like to revisit the post I wrote on November 10, suggesting that AAPL, at $116.77, was forming a head and shoulders top.
 This weekly chart shows what happened to AAPL after my November post.
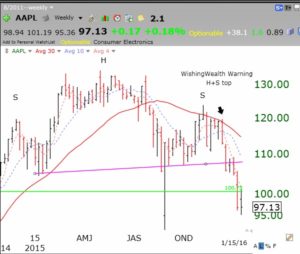 AAPL is now at $97.13. Sometimes my prognostications work out! But will it fall to my target, around $80?
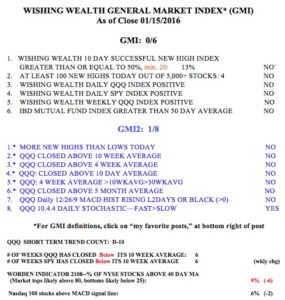
And here is the GMI, still 0 (of 6) and on a Sell signal since mid-December.
