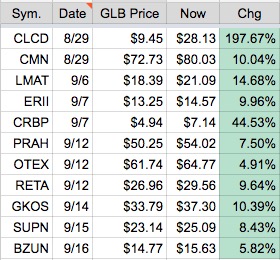
I updated the GLB Tracker Table. It now shows stocks that evidenced a strong week last week by hitting an all-time high on large volume, and that had a GLB last week or since 8/29. I could not bring myself to delete CLCD, up 197% since it passed its green line break-out point–a lucky pick! This list does not contain all GLB stocks that occurred during this period. It contains only those that have held their GLB (i.e., successful) and have strong technicals and/or fundamentals. The performance of the stocks in the GLB Tracker Table updates during the trading day. While the table appears daily to the right of this post, I thought it useful to show it below too. These are stocks at or close to their all-time highs that need to be researched before I purchase. One benefit of these stocks is that they are less likely to be extended because they have recently broken out above a prior all-time top and therefore may have been just launched on a new journey upward.
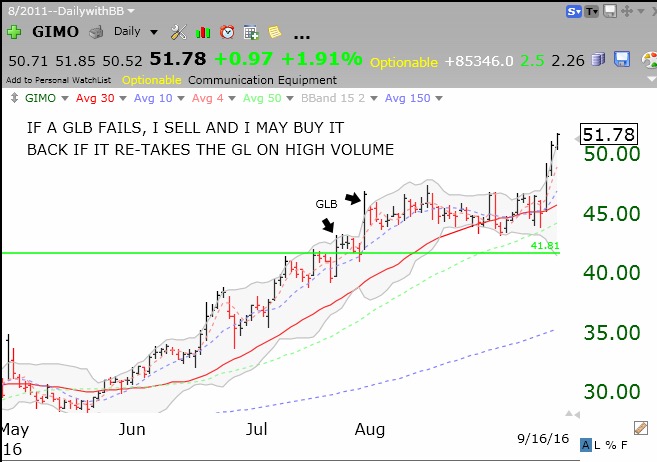
If I buy a GLB stock I immediately sell it if it trades back below its green line break-out point–no exceptions. If it then comes back above its green line on good volume, I might buy it back. This was the situation with GIMO.
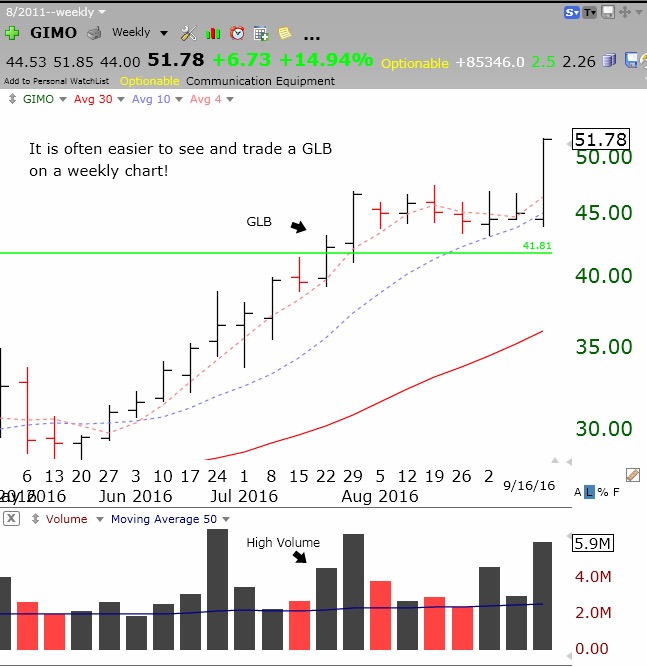
I find that a daily chart can often lead me to be whipsawed and to sell a good stock too soon. It’s like checking one’s blood pressure or cholesterol too often. Look at how nice GIMO’s post break-out consolidation appears in this weekly chart. Up weeks occurred mostly with higher volume than with down weeks. No reason to sell out early if I had focused on the weekly pattern……..(luckily I bought it back)
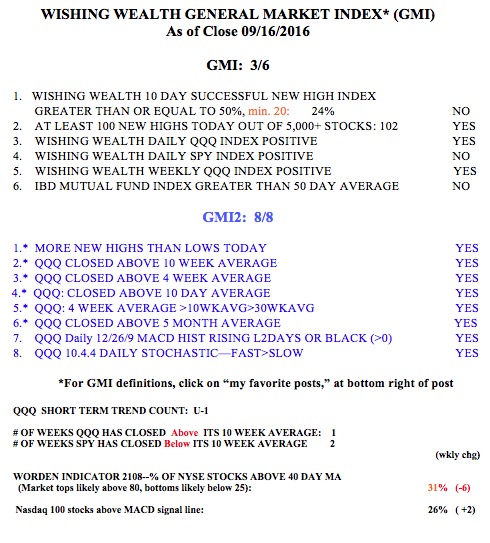
The GMI remains on a Sell Signal but my QQQ short term trend indicator has just turned up! There is a huge divergence between the tech stocks, reflected in the QQQ, and in the large cap stocks measured by the SPY and DIA. Thus the QQQ closed back above its 10 week average while the SPY and DIA remain below their 10 week averages. This is a schizoid market! Either the QQQ will turn out to lead stocks back to a new up-trend or it will revert to the downward trend of the other indexes. Maybe this will all be resolved after the FED speaks later this week, or after the Presidential election? I am buying break-outs but am very defensive, with small positions and close stops.
do you have a list of how many GLBs failed to hold?