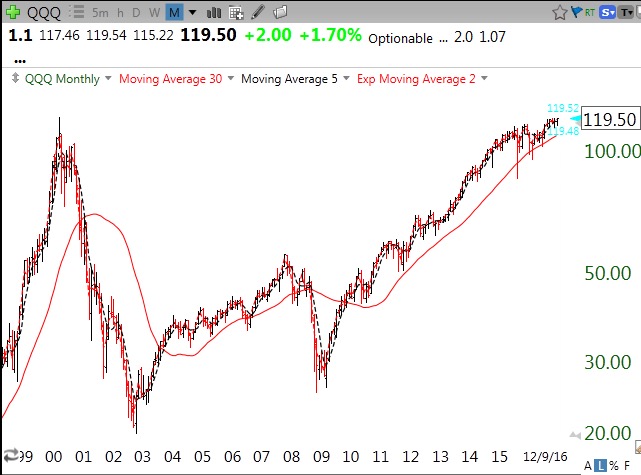
It looks like we are getting the year end/end of quarter rally that should take us through the end of December. After that, we get to see what a Trump administration will do and how easy it will be for them to manage the government. As the news heats up in January with stories of turmoil within the various factions of the government, it may be a good time for the market to come back down to reality. All of this sounds likely to me, but it is better to remain vigilant and let Mr. Market tell me his likely direction. For now, it is full steam ahead, with the QQQ back above its 10 week average with the DIA and SPY. This monthly chart shows that the QQQ (119.50) is getting close to its all-time high of 120.50, reached in March of 2000. A break through this top on above average volume would be quite a sign of technical strength. Note that the 2000 top came after a vertical rise, and that the current market is not showing similar signs of irrational exuberance—yet………..
I recently worked on a new scan that I have added to those stored and accessible in my TC2000 Club. If you want to access and run these scans you need to have a TC2000 account and then join my Club. Once you do so my Club will appear in your Library tab. The link to join my Club is: https://www.wishingwealthblog.com/club/ Just paste it into your browser.
Here is a picture of the conditions stored in this new scan and its name:
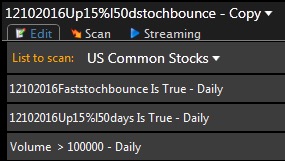
This scan finds all US Common Stocks which meet 3 conditions. The fast daily 10.4 stochastics has to be above its long daily 10.4.4 stochastics and the fast stochastics must have been <20 in any of the past 2 days. Thus the stochastic is moving up from oversold. The fast stochastic must also be <=50 so it is not too extended above the bounce and the stock must close above its 50 day average. The second filter requires the stock to have had a minimum 15% increase from its 50 day low at anytime during the past 50 days. This will find stocks that have popped up at least 15% and just bounced from an oversold stochastics. The third filter requires trading volume of > 100,000 shares the most recent day.
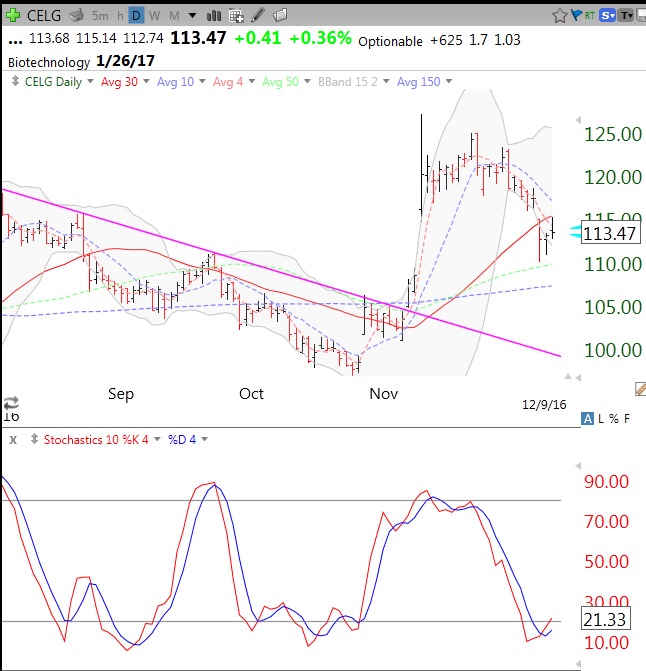
Based on Friday’s close, this scan detected 5 stocks: CELG, MMS, HELE, AVXS, FTV. I then looked over the fundamentals and technicals of each. HELE is in a Stage II decline and I dropped it from further study. Here is the chart of CELG. I like the fact that CELG is also finding support at its lower 15.2 daily Bollinger Band, a pattern not required by this scan but still very promising. As an educational example, the way I might play this set-up would be to buy CELG Monday and place a sell stop below its recent bounce just below $110. Given the focus of this scan on a rebounding stochastics, I would also subsequently sell CELG if/when the fast stochastics closes back below the slow stochastics. Here is the daily chart of CELG. Note the cross-over of its fast stochastics above its slow stochastics and CELG’s recent surge in price after breaking out of a down-trend. I like to buy stocks that consolidate after a large gap up and then move up. Some of the other remaining three stocks from this scan may also merit further research. When I see promising patterns I often tweet about them intraday (@wishingwealth).
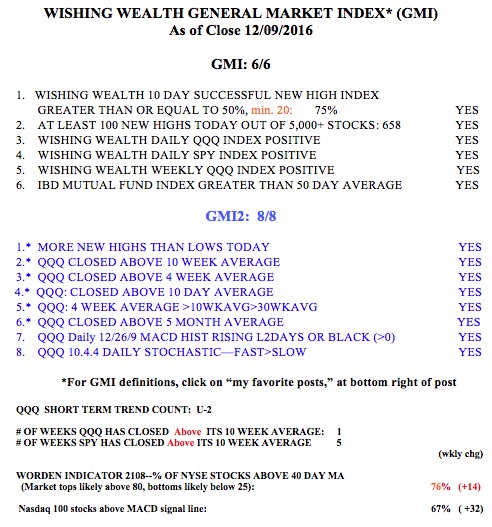
The GMI components are all positive. But T2108 is getting close to 80%…..