The RLC (red line count described in yesterday’s post) for the indexes are: QQQ=6, SPY=0 and DIA=1. Thus the QQQ remains in a strong up-trend even as the other two indexes remain much weaker. The DJ-20=0 and is again causing me some concern, as I noted yesterday. GLD is rising with an RLC=6. Ten of the Dow 30 stocks have an RLC=0 and another 3 have an RLC=1 or 3. GS is an example of a Dow stock with an RLC=0.
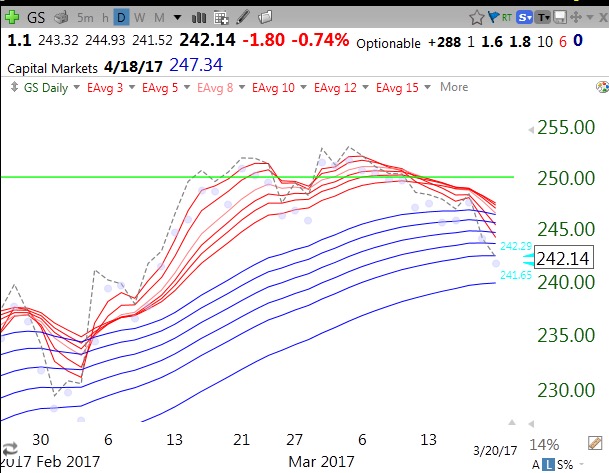
After failing to hold its green line break-out (GLB), GS has declined so that it closed (closes shown by dotted line) below all of its 6 red line averages (hence RLC=0) and is now below most of the blue lines. While this is not the kiss of death, I would not buy GS again (or hold it) until GS can close back above its 6 red lines (RLC=6) like it did in early February.
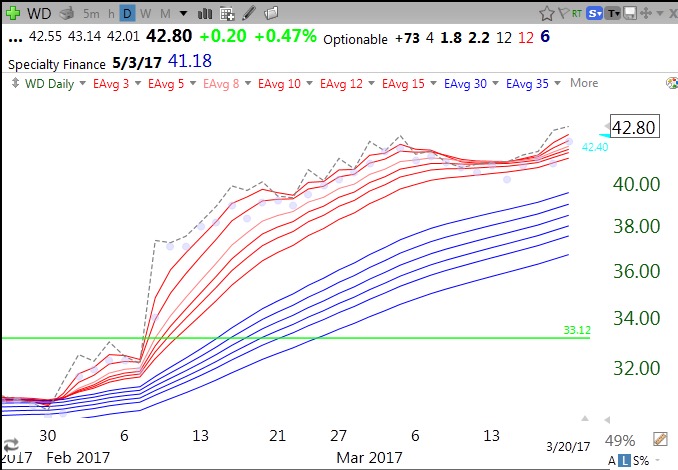
WD shows the type of strong action that might interest me. (WD came up in the scan I described yesterday, which you can get by joining my TC2000 Club.) After having a GLB in early February, WD advanced and then consolidated and now has broken out. It has an RLC=6 (see end of first line on chart). Its lowest red line = 41.18 (see end of second line on chart), which is around where I might place my first sell stop. However, recent daily lows (shown by purple dots) are around 40 and may be a better place of prior support to set my stop. Alternatively, if I had bought the stock in February I might wait for the stock to close at its top blue line, around 39 to exit. When the RWB pattern disappears I must exit. Another strategy is to sell half a position at the higher stop and the rest at the highest blue line.
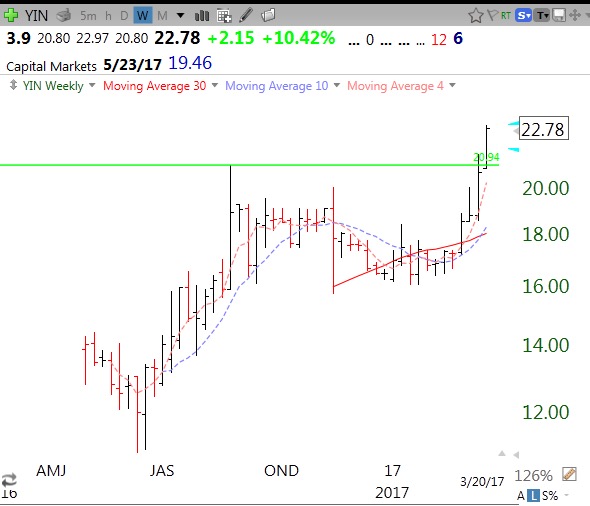
This weekly chart shows that the 2016 IPO, YIN, has had a GLB (Monday on high volume).
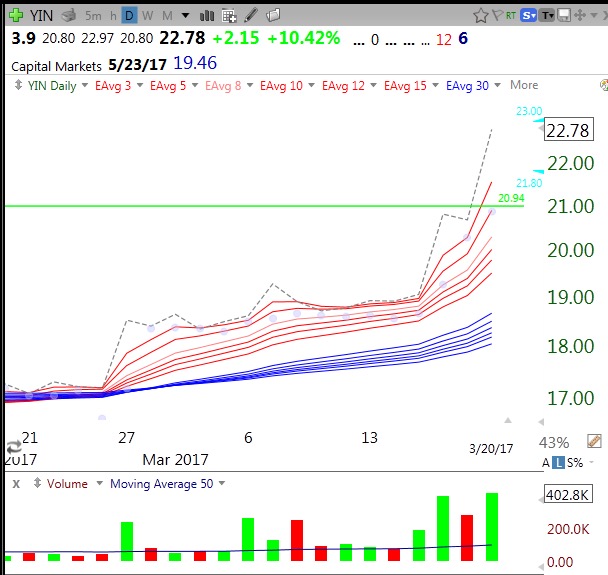
Here is the RWB daily chart for YIN. Note its strong RWB pattern and that the RLC was 6 just about every day.