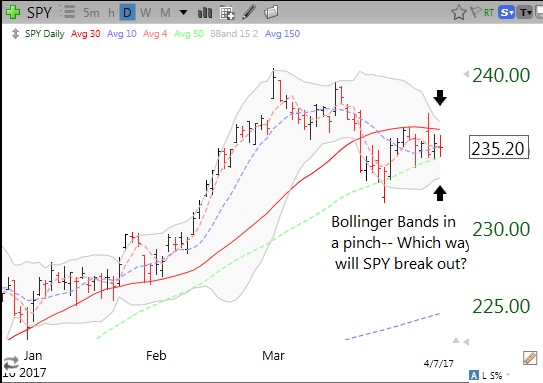
The QQQ short term up-trend is now 83 days old, not far from the longest (88) since 2006. Meanwhile the DIA and SPY are weaker than the QQQ. DIA and SPY are in a Bollinger Band (15.2 daily) pinch. That means there is a contraction in price movement, reflected in the bands’ approaching each other. Eventually the index will break outside one of the bands. Low volatility leads to higher volatility. Too bad, however— price can move in either direction. We just have to monitor the situation and get ready to act. Note the SPY is finding repeated support at its 50 day average (green dotted line). A close below the 50 day average (234.51) may be a good clue that the market is breaking down.
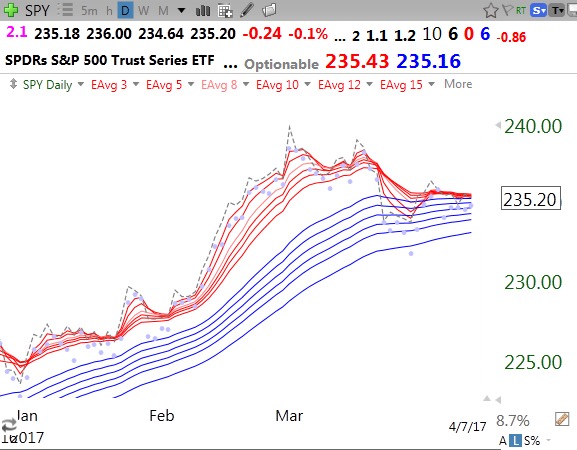
This daily RWB chart shows more clearly the tightening of the prices, with all of the short term averages (red lines) constricted. SPY has a 6/0/6 pattern, closing below all of its 6 red lines but just above all of the blue lines (longer moving averages). Note the RWB pattern is gone. Note also how long (January to mid-March) the SPY was in a RWB pattern (see my glossary for definitions) and a good time to be long the SPY.
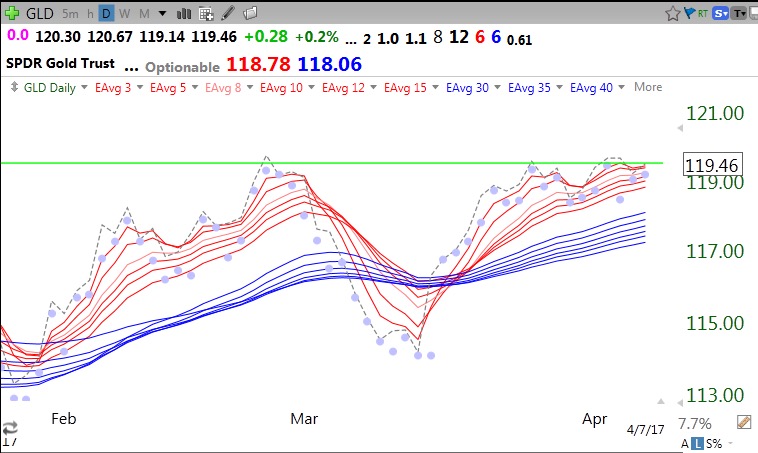
GLD remains in a 12/6/6 RWB pattern, up against resistance. A close (dotted line) below the lowest red line (118.78) would be a possible sign of weakening of the RWB pattern, as last occurred in early March.
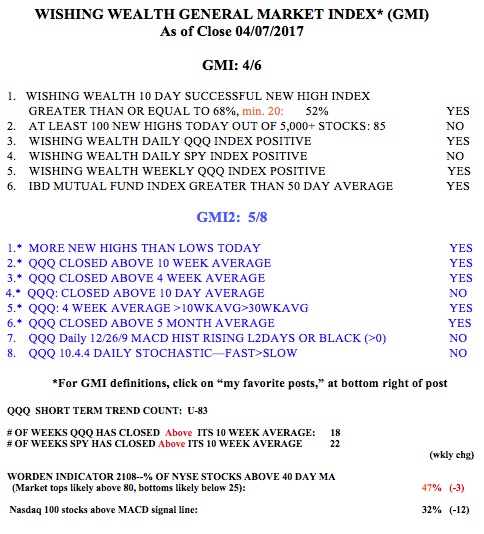
The GMI is at 4 (of 6).