While the GMI remains Green and the QQQ short term trend remains up (U-12, see table below), I am concerned by the lack of follow-through on a lot of GLBs (green line break-outs) recently and the number of high volume down days on the QQQ. Look at this daily chart of the QQQ. Most of the high volume days have been down days (red spikes).
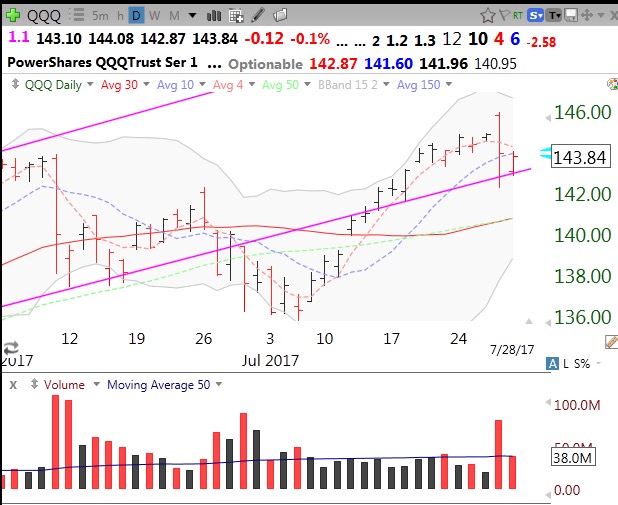
These are what IBD calls distribution days. They can signal a top. And once earnings are out, we will enter the post-earnings lull when the market often weakens. I have seen a lot of declines in September/October. While I still hold some small long positions, I will run quickly if they falter. People have become complacent and now think that the market must always rise. I have been watching the markets since the 1960s and have seen repeatedly that the good times eventually end. The real winning traders are those who protect their accounts when the market declines.
Almost every stock that came up on my scans this weekend reports earnings this week. I will therefore not list them. Here is one stock that reported good earnings last week that is flying high on marihuana and had a GLB (breaking its 2008 peak). While TC2000 sent me my programmed alert of this GLB after Wednesday’s open, I was away and missed the break-out. I think BCO is still worth watching now that it is smoking….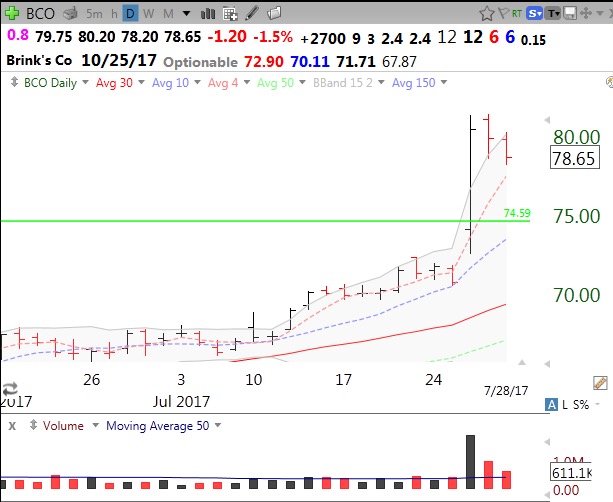
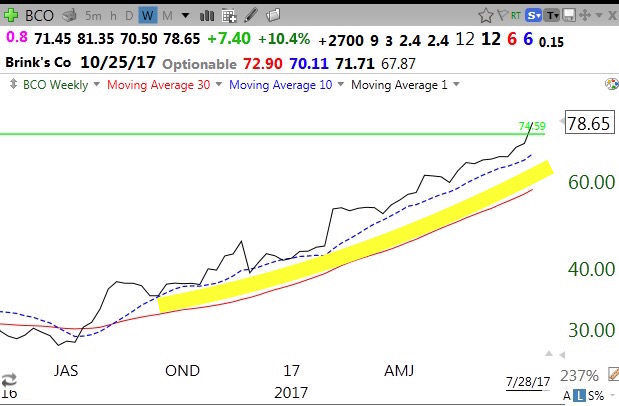
Wha a nice weekly yellowband advancing pattern! Is BCO too high or on a roll?
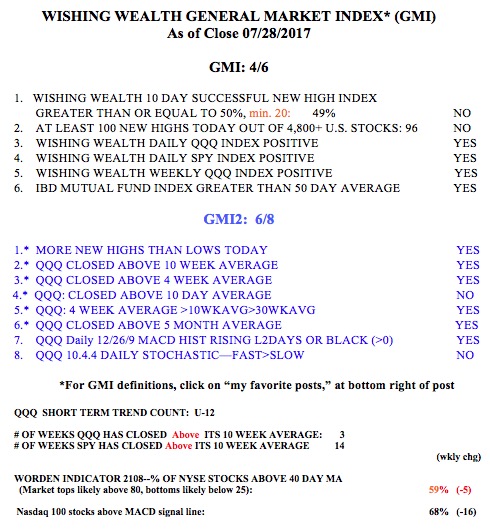
Here is the GMI table.